Timeframes · Beginner
TradingView Timeframes: What 1m, 5m, 1H, 1D, and 1W Mean for Beginners
Many beginners looking at TradingView run into this: the 5-minute chart looks ready to rally, but switch to the daily and the trend seems weak; RSI is high on 15m but the 4-hour hasn't reacted yet—usually the indicator or chart isn't wrong; you're looking at two completely different levels of market rhythm.
Bottom Line First: The Timeframe Determines the Market Rhythm You See
A timeframe determines how much time one candle covers. For example 1m means 1 minute, 5m means 5 minutes, 1H means 1 hour, 1D means 1 day, 1W means 1 week—this isn't a zoom issue, but a different granularity of information.
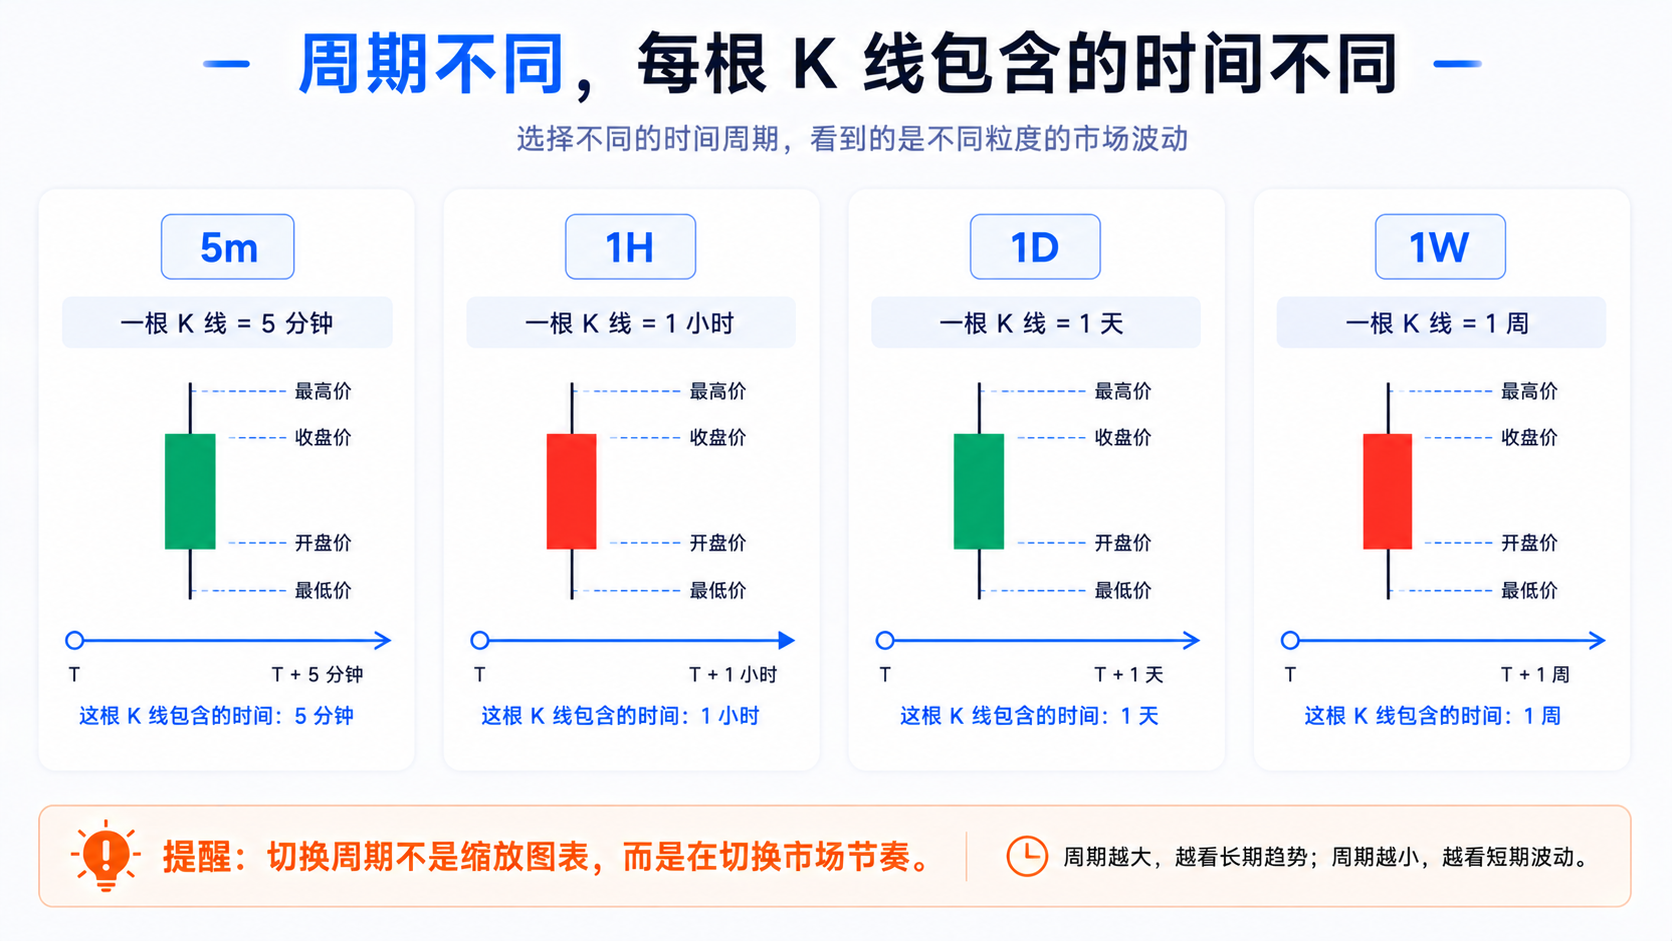
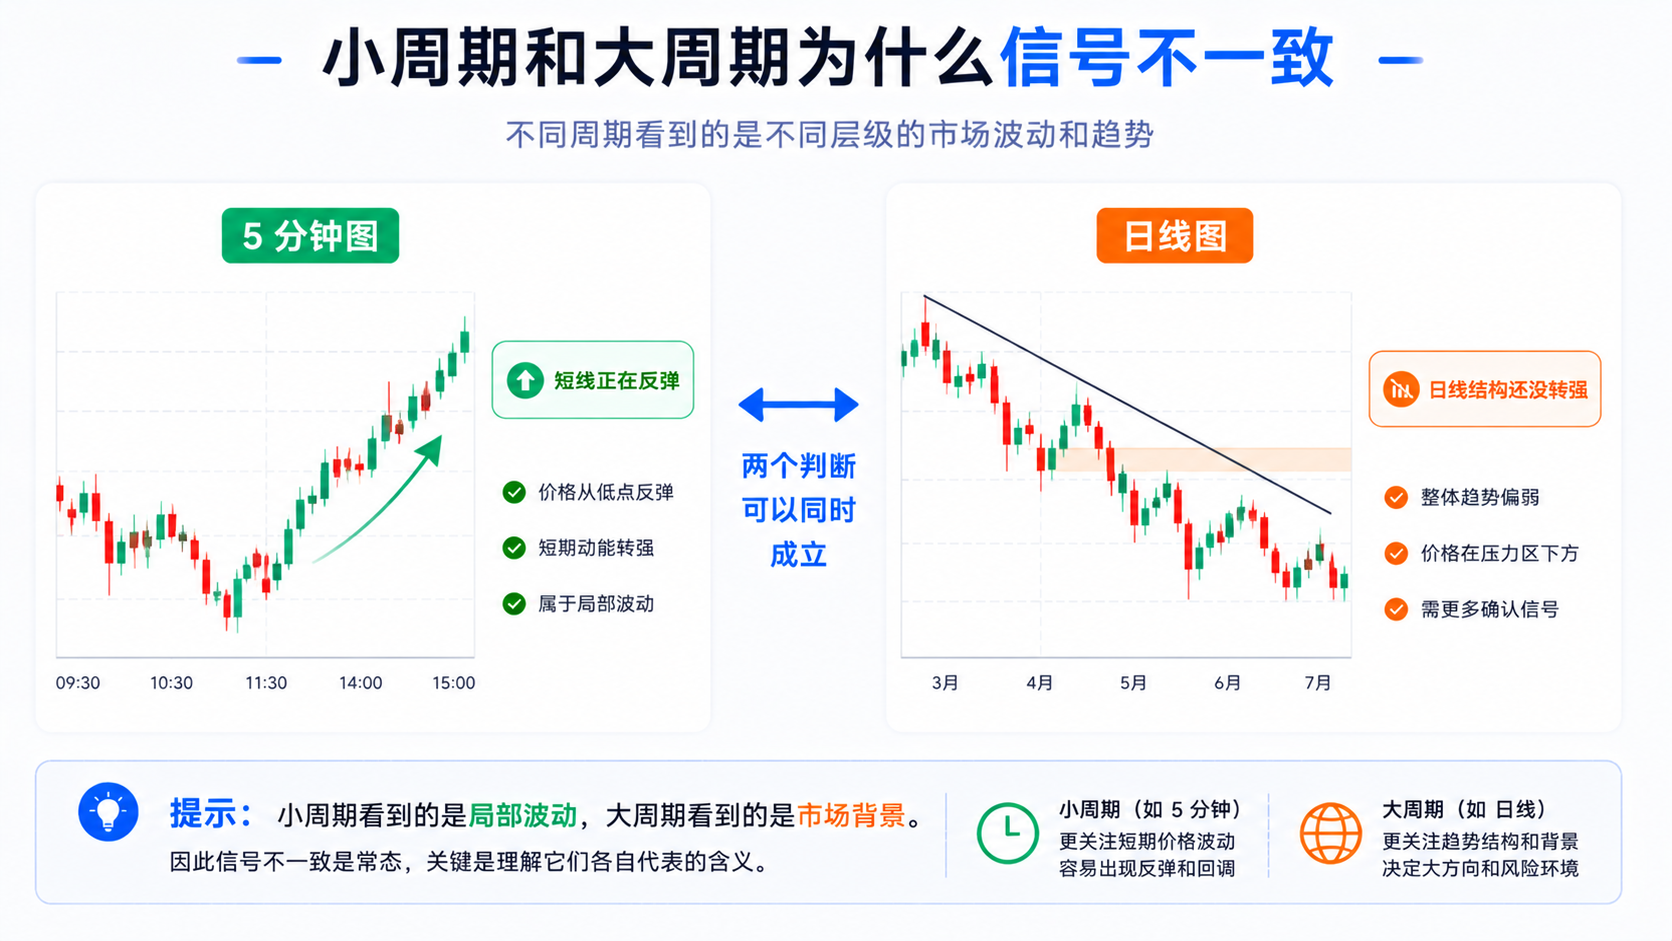
A 5-minute chart shows short-term swings, the daily shows day-level structure, and the weekly shows the larger trend backdrop. Inconsistent signals across timeframes are normal: 5m may show a "short-term bounce" while the daily still shows "not yet strengthening overall"—both can be true at once.
What Are Minute Timeframes Good for Observing?
Minute timeframes usually include 1m, 3m, 5m, 15m, 30m, and so on, good for observing price changes over short periods, for example:
- Fast swings after the open;
- Short-term reactions after news releases;
- Intraday support/resistance;
- Short-term volume changes;
- Intraday pullbacks and bounces;
- Price details after an alert fires.
Minute charts are detailed, but they also easily bring small swings, small breakouts, and small false signals. Staring at 1m or 5m for long makes it easy to be led emotionally by every candle. Minute charts better answer "how it's moving intraday", "the details after an alert fires", and "whether it's near a marked area"—not good for deciding the big direction on their own.
What Are Hourly Timeframes Good for Observing?
Common ones are 1H, 2H, 4H—steadier than minute charts, finer than the daily, filtering out some short-term noise.
Hourly charts are good for observing:
- Short-to-medium-term trends;
- Whether price is running within a range;
- Whether a pullback is over;
- Structure changes from intraday to a few days;
- Whether indicators are starting to turn;
- The transitional rhythm between timeframes.
For example, if the daily is still in an uptrend, use 4H or 1H to see whether it's pulling back short-term. Hourly charts bridge short-term swings and the larger backdrop; but a breakout on 1H doesn't mean the daily has confirmed a breakout.
What Is the Daily Good for Observing?
On the daily (1D), one candle represents a day—one of the timeframes beginners should value most; steadier than minute charts and better for observing overall structure.
The daily is good for:
- The big direction;
- Support/resistance;
- Whether the trend continues;
- Whether a range breaks out;
- Volume changes;
- The overall reaction after earnings or macro events;
- Medium-term review.
A strong 5-minute bullish candle may just be a bounce to a prior resistance level on the daily. It's recommended to look at the daily first each day, then the hourly, and finally the minute charts—know where the market is first, then look at details.
What Is the Weekly Good for Observing?
On the weekly (1W), one candle represents a week, good for the long-term trend and position—for example long-term rises/falls, multi-year highs/lows, major-timeframe support/resistance, long-term ranges, and important trend lines.
A continuous rise on 15m may just be a bounce to a long-term resistance zone on the weekly. The weekly is like a map, the minute chart like street view—don't just look at street view and forget where you are in the city.
How Do You Switch Timeframes in TradingView?
At the top of the chart you'll usually see the current timeframe buttons, like 1m, 5m, 15m, 1H, 4H, 1D, 1W—click to switch.
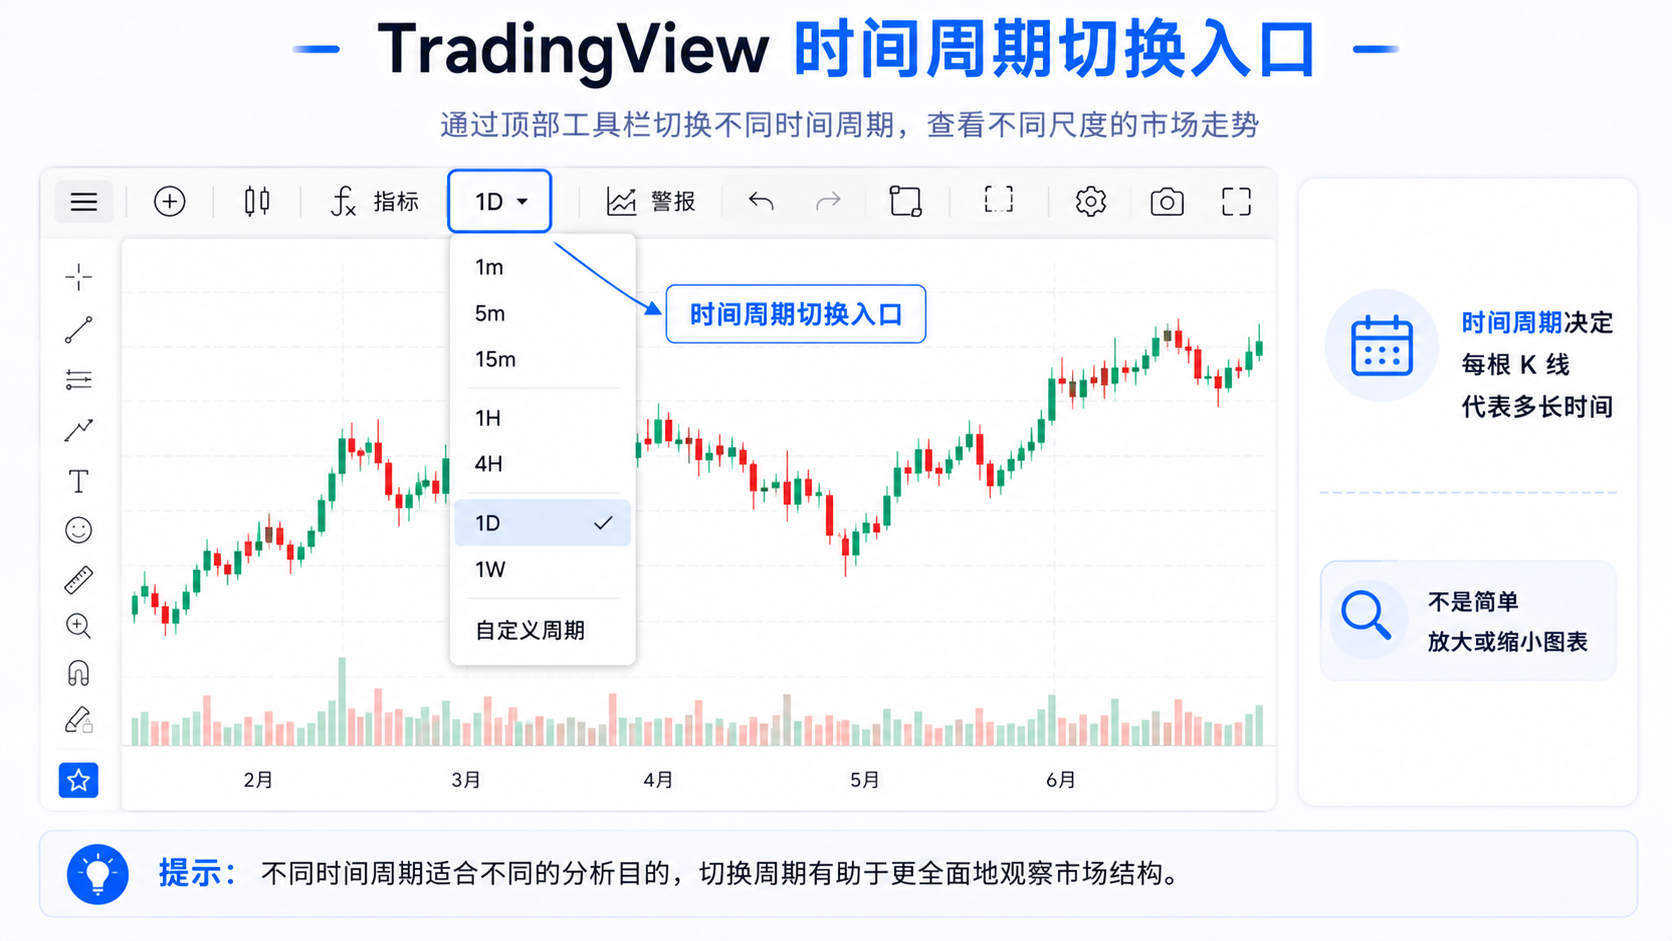
You can also type it directly, for example:
- Type
15for 15 minutes; - Type
1Hfor 1 hour; - Type
4Hfor 4 hours; - Type
1Dfor the daily; - Type
1Wfor the weekly.
Positions may vary by interface version, but the core logic stays: the timeframe controls the time span of each candle. If the chart suddenly "changed", first check whether you switched from 1D to 15m.
What Scenarios Are Custom Timeframes Good for?
TradingView supports some custom timeframes, like 2 minutes, 3 minutes, 45 minutes, 2 hours, 12 hours, 2 days (depending on account and interface), good for users with a clear observation habit.
For example, if 1H feels too fine and 4H too slow, try 2H; to observe a 24-hour market use 12H; when reviewing, split it by your own rhythm. But beginners shouldn't get obsessed with custom timeframes early—constantly switching among 5m, 15m, 30m, 2H to find one that "supports your view" easily gets messier.
Why Does the Same Indicator Signal Differently Across Timeframes?
This is completely normal: indicators compute on the candles of the current timeframe.
For example RSI 14: on a 5-minute chart it's the last 14 five-minute candles; on the daily it's the last 14 daily candles—not the same thing at all. 5m RSI may be overbought, 1H just strengthening, and 1D still weak, and none are wrong—they're just different rhythms.
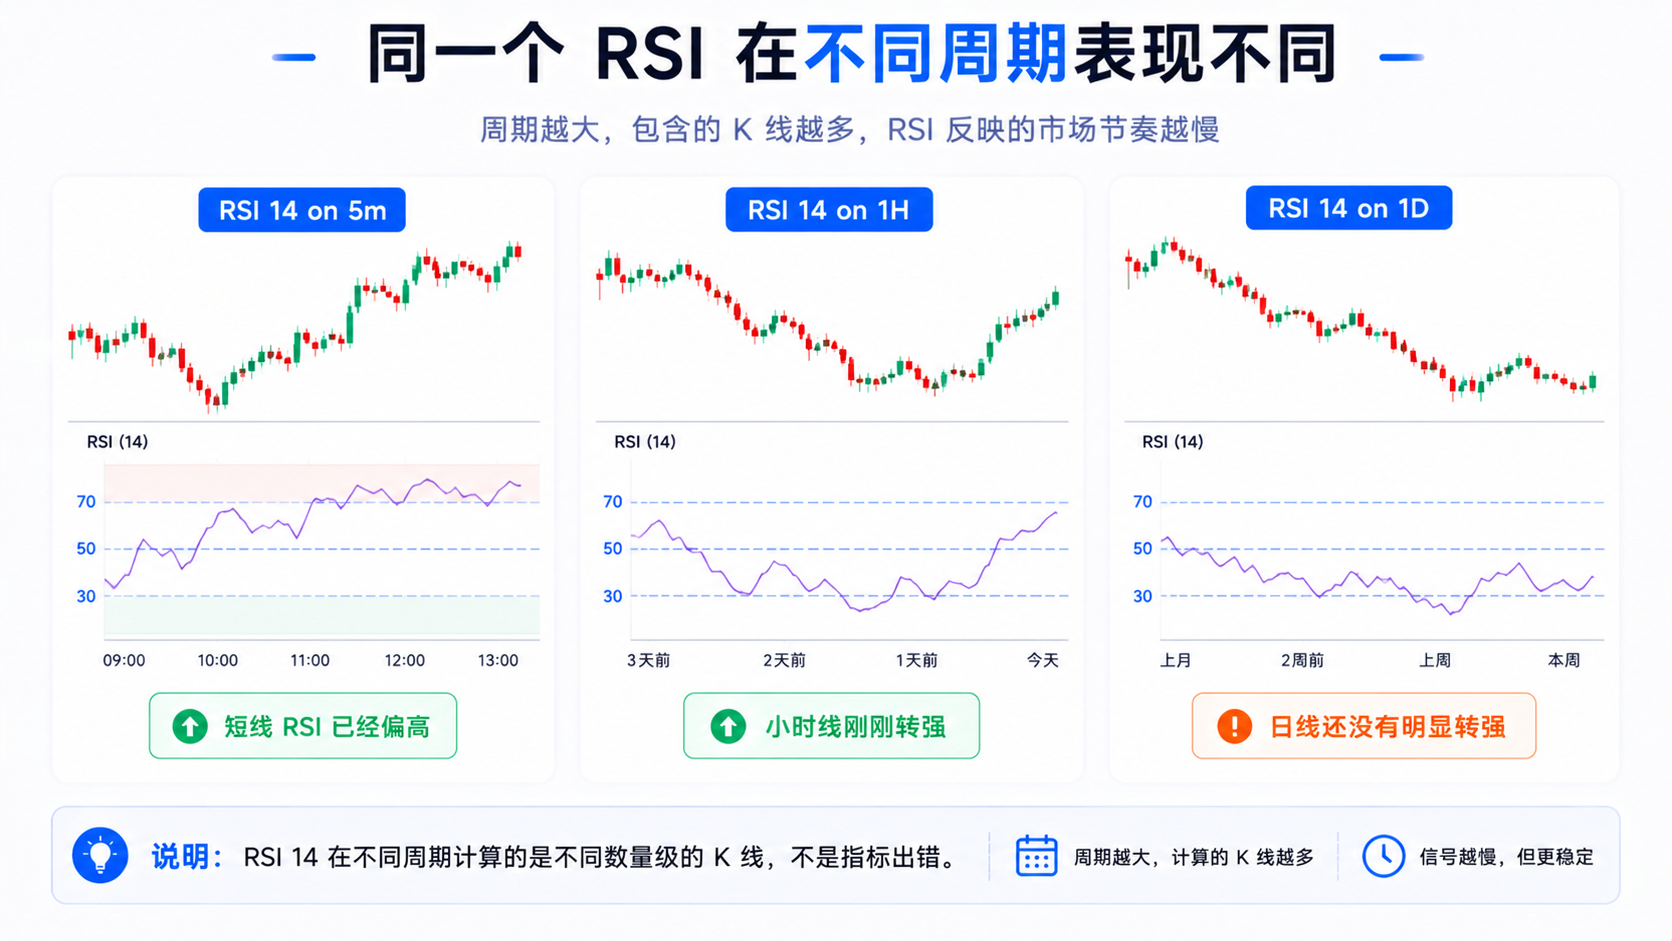
Moving averages are the same: a 20 EMA on 5m is the average of the last 20 five-minute candles, on the daily the average of the last 20 days. You can't demand "the 5-minute MA had a golden cross, why hasn't the daily?"—the data ranges differ.
Why Are Alerts, Indicators, and Drawings Affected by Timeframe?
1. Technical Alerts Are Affected by Timeframe
Setting "RSI crossing above 50" on a 15-minute chart monitors the 15-minute RSI; setting it on the daily monitors the daily RSI. The same condition may trigger at completely different times across timeframes. Always check the timeframe when setting an alert, or you'll think you set a daily alert while it's actually a 5-minute one, making notifications very frequent.
2. Indicators Are Affected by Timeframe
The smaller the timeframe, the more sensitive the indicator; the larger, the steadier but slower to react. Small-timeframe indicators often "jump around", while larger ones are smoother—neither is absolutely better, just different observation purposes.
3. Drawings Are Affected by Timeframe
Support/resistance drawn on the daily may look far away on 5m; a 5-minute short-term trend line may lose almost all meaning on the daily. Daily support/resistance shows large areas, hourly trend lines show phase structure, and minute drawings show short-term swings—don't force small-timeframe drawings onto large timeframes.
Beginner Multi-Timeframe Workflow: Larger First, Then Smaller
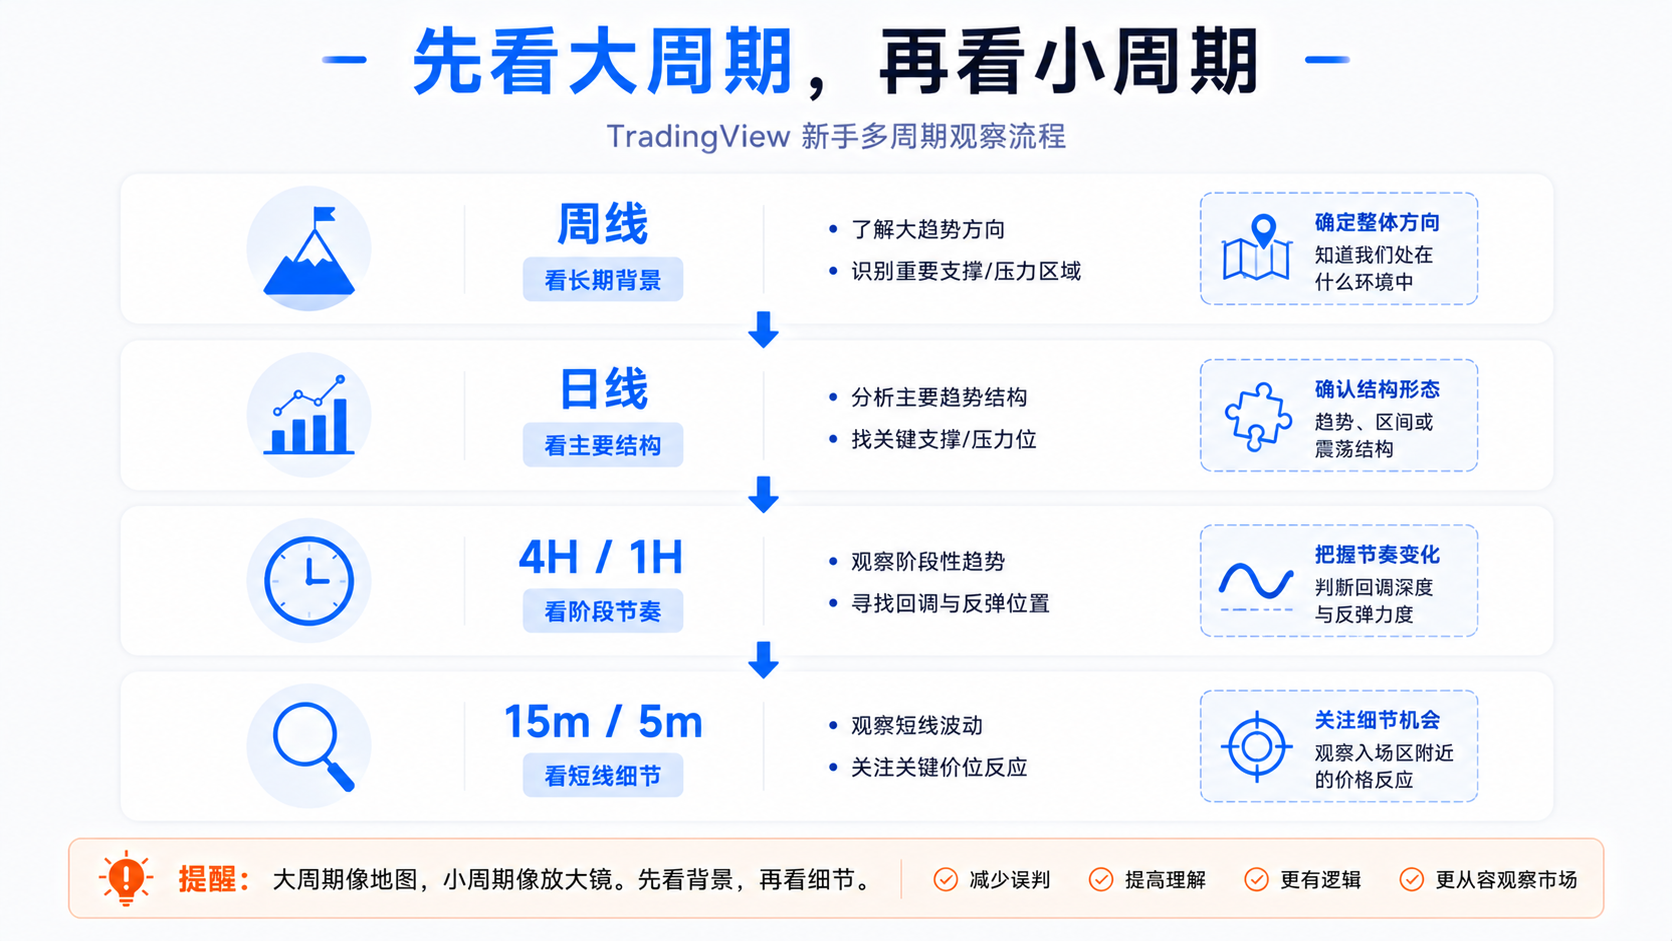
- Look at the weekly first: long-term high or low? Overall rising, falling, or a big range? Any long-term support/resistance?—establish the big backdrop.
- Then the daily: trend strength, key areas, volume, breakout/pullback/consolidation—the daily is the timeframe beginners should focus on most.
- Look at 4H or 1H: is the short-to-medium term consistent with the daily? Pullback or continuation? Near a key area? Are indicators weakening or strengthening?
- Finally 15m or 5m: only details—reactions at key areas, moves after news, intraday swings, short-term false breakouts—don't use 5m to overturn the weekly and daily backdrop.
How Can Different Users Choose Timeframes?
| User type | Better focus |
|---|---|
| Brand-new beginner | Daily + 4H |
| Long-term observer | Weekly + Daily |
| Swing reviewer | Daily + 4H + 1H |
| Intraday observer | Daily backdrop + 15m / 5m |
| News-event review | 1H + 15m + 5m |
| Crypto observer | Daily + 4H + 1H, optionally add 12H |
| ETF / index observer | Weekly + Daily + 4H |
This isn't a fixed rule; the key is knowing why you're looking at this timeframe, not because a certain timeframe "looks more like the conclusion you want".
Common Misconceptions: Why Beginners Get Messier Switching Timeframes
Misconception 1: Treating a Small-Timeframe Signal as the Big Trend
A 5-minute bounce doesn't mean the daily trend reversed; a larger timeframe needs more time to confirm.
Misconception 2: Assuming an Indicator Is Wrong Because Timeframes Disagree
First ask whether you want short-term momentum or medium-term trend, instead of blaming the indicator.
Misconception 3: Switching Timeframes Frequently for a Sense of Confirmation
Keeping bullish views, deleting bearish ones—this easily forms confirmation bias.
Misconception 4: Using One Timeframe for Everything
Weekly for backdrop, daily for structure, hourly for rhythm, minute for details—each answers a different question.
Misconception 5: Forgetting the Timeframe After Setting an Alert
A 5-minute RSI alert isn't a daily signal; confirm the timeframe and trigger before setting.
Summary: A Timeframe Isn't a Zoom Button, It's a Choice of Market Rhythm
A TradingView timeframe determines how much time each candle represents. 1m, 5m, 15m show short-term swings; 1H, 4H show phase rhythm; 1D shows the main structure; 1W shows the long-term backdrop. Different timeframes may differ in indicators, drawings, and alerts—inconsistent signals don't mean the chart is wrong.
The steadiest way for beginners is larger first, then smaller: weekly and daily set the backdrop, hourly shows rhythm, minute shows details. Don't stare at one timeframe, and don't switch frequently to find an answer that "looks nice".
FAQ
What do 1m, 5m, 15m, 1H, and 1D mean in TradingView?
They represent chart timeframes. 1m means one candle covers 1 minute, 5m is 5 minutes, 15m is 15 minutes, 1H is 1 hour, 1D is a day, and 1W is a week. The timeframe determines how much time each candle covers—not just zooming the chart.
Why are indicator signals inconsistent across timeframes?
Because indicators compute on the current timeframe's candles. RSI 14 has completely different data ranges on a 5-minute chart vs the daily, so signals can differ—that's a different timeframe level, not an indicator error.
Which timeframe should a beginner look at?
Focus on the daily first, paired with 4H or 1H; switch to 15m or 5m when you need finer detail. Don't stare only at 1m or 5m from the start, or short-term swings easily throw you off.
Can you set custom timeframes in TradingView?
Yes, e.g. 2 minutes, 45 minutes, 2 hours, 12 hours, depending on the current account and interface. Custom timeframes suit users with a clear habit; beginners shouldn't use too many custom timeframes at first.
Does the timeframe matter when setting an alert?
Very much. The timeframe you set an alert on usually runs the condition based on that timeframe. A 15-minute RSI crossing above 50 isn't the same signal as a daily one, so confirm the timeframe, parameters, and trigger before setting.