Indicators · Beginner
TradingView Indicator Templates: Save, Apply, and Organize Your Indicator Sets
Many people re-add EMA, RSI, MACD, and volume every time they open a new symbol—a better approach in TradingView is to save your favorite combos as an indicator template, applying it with one click when switching instruments, without searching, changing parameters, and adjusting colors again.
Bottom Line First: Templates Are for Reuse, Not for Piling On Indicators
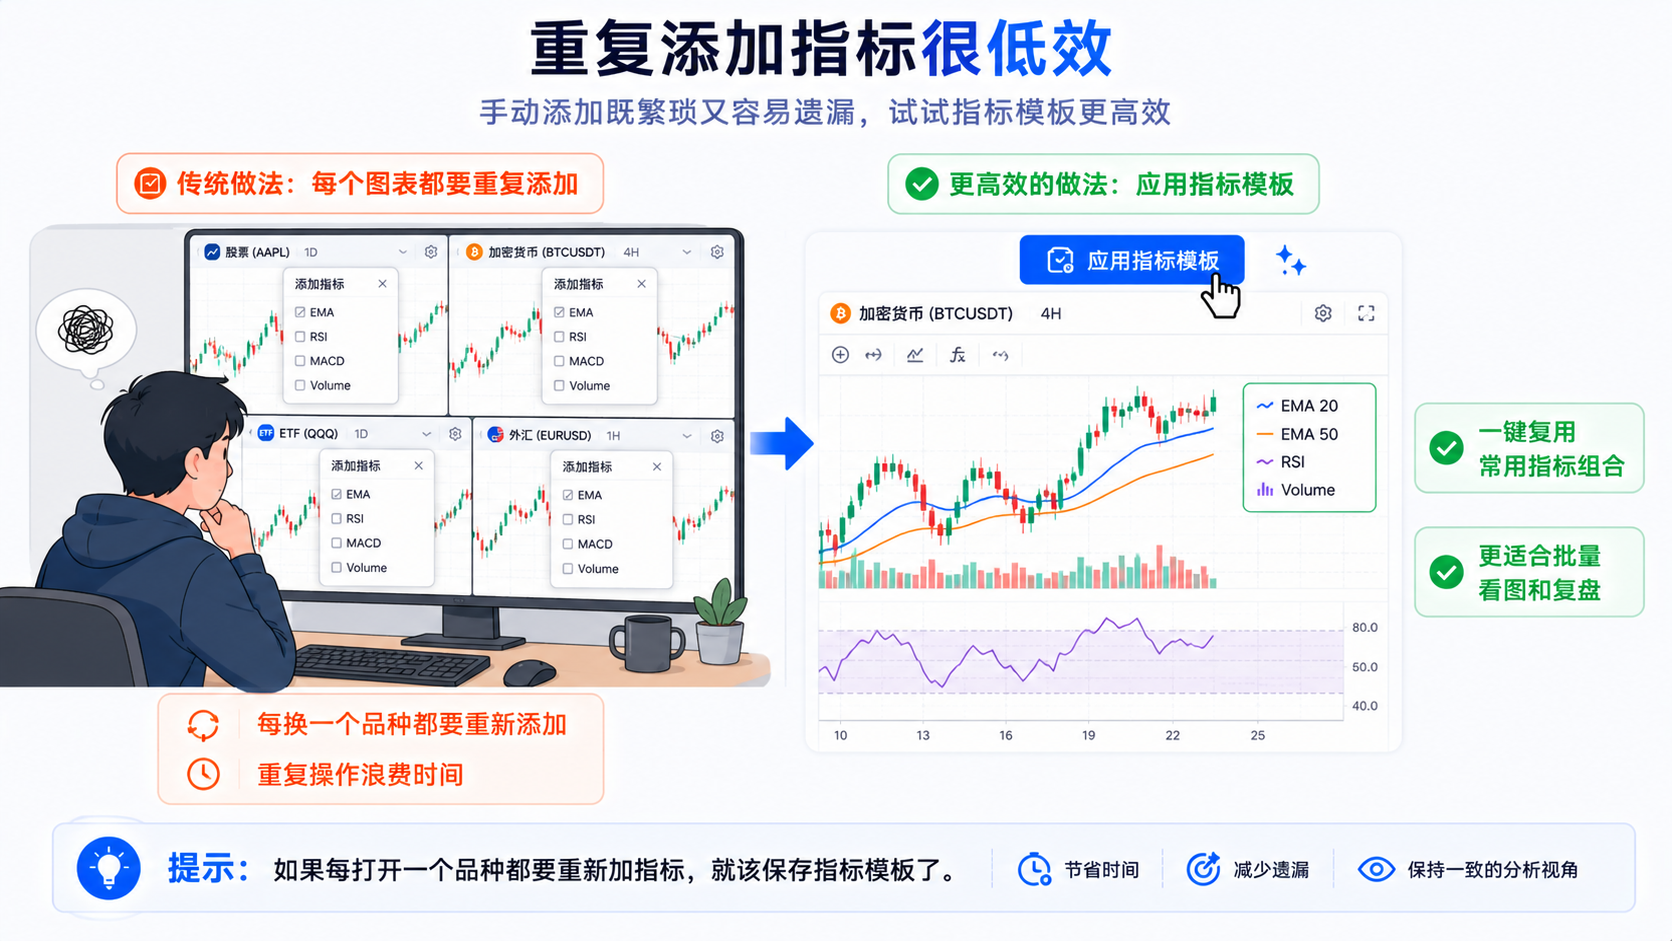
The core value of indicator templates is reducing repetitive work, good for saving common combos like EMA + Volume, RSI + MACD, VWAP + Volume, moving-average sets, or intraday-review/trend-momentum kits.
But more templates isn't better. Saving a pile of "Template 1", "let's try", and "BTC template" becomes indistinguishable in a few days—the point of a template is a clean workflow, not a new junk pile. A template you haven't used in a month can be cleaned up.
What's the Difference Between an Indicator Template and a Chart Layout?
An indicator template mainly saves the indicator combo, parameters, and some styles on a chart; a chart layout saves a more complete workspace (symbol, timeframe, settings, drawings, indicators, window layout, and so on).
An indicator template is like a "tool combo", a chart layout is like the "whole workbench".
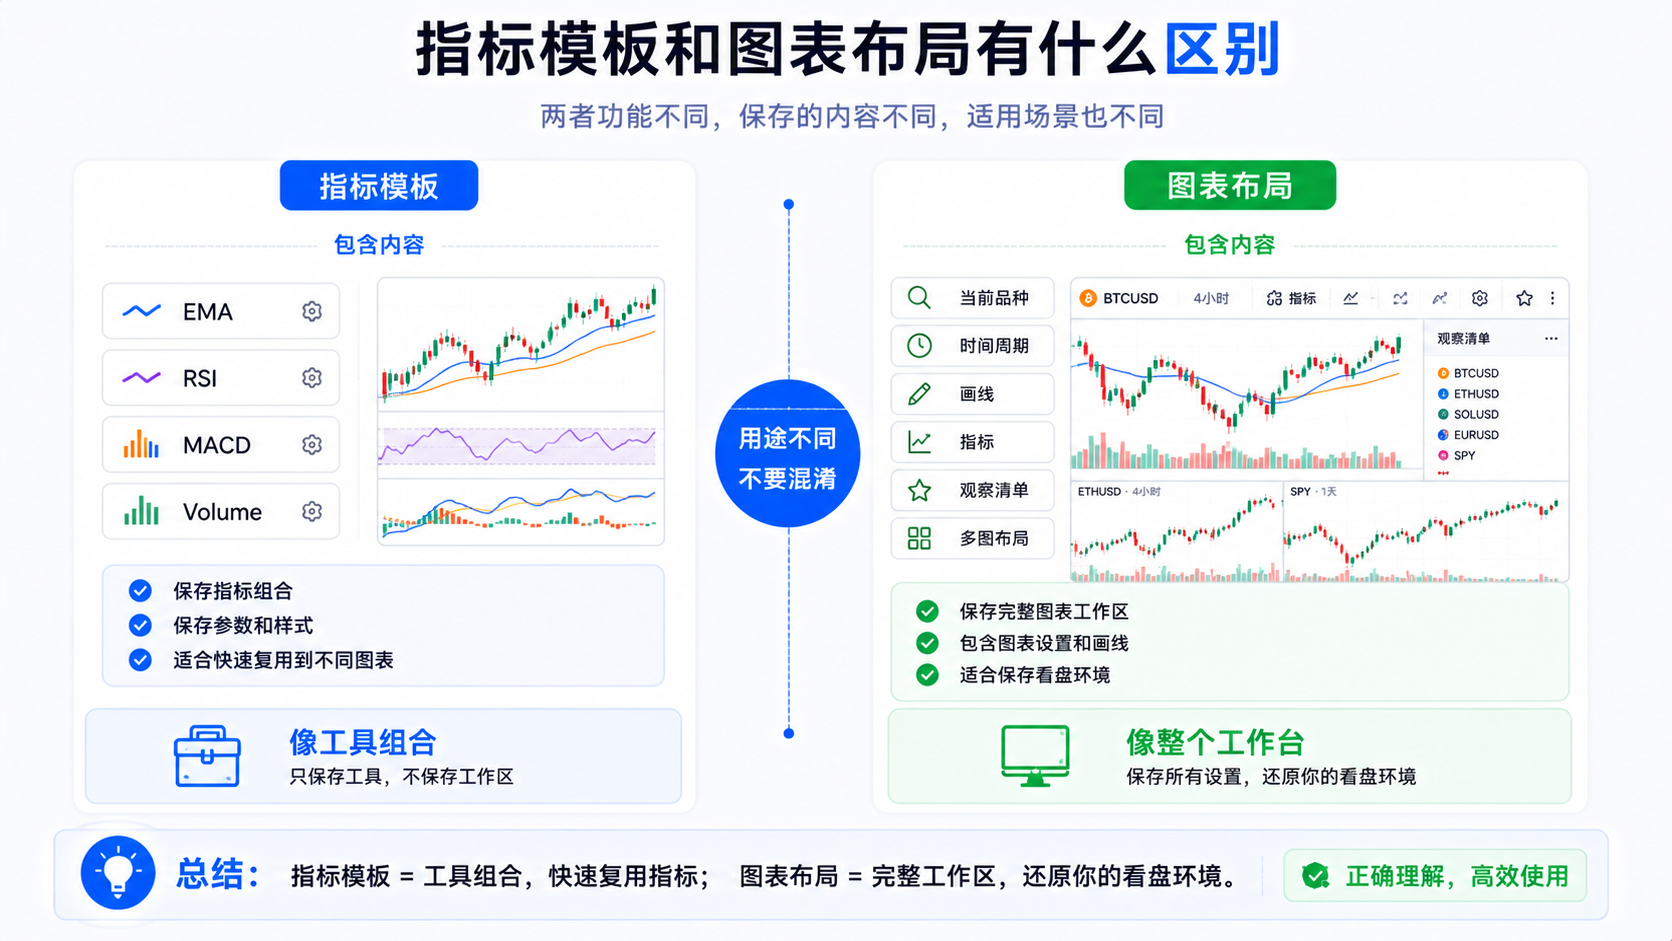
| Item | Indicator template | Chart layout |
|---|---|---|
| Mainly saves | Indicator combo, parameters, styles | Workspace, drawings, indicators, layout state |
| Best for | Quickly reusing common indicators | Saving a complete watching environment |
| Cross-instrument use | Suitable | Possible, but more workspace-oriented |
| Common beginner misunderstanding | Thinking it saves all chart content | Thinking it only saves the current instrument |
Just want to apply the EMA, RSI, MACD combo to different charts → use an indicator template; want to save your whole watching desktop → use a chart layout.
How to Save a TradingView Indicator Template
The interface may vary slightly by version; the core flow is below (follow the current official interface).
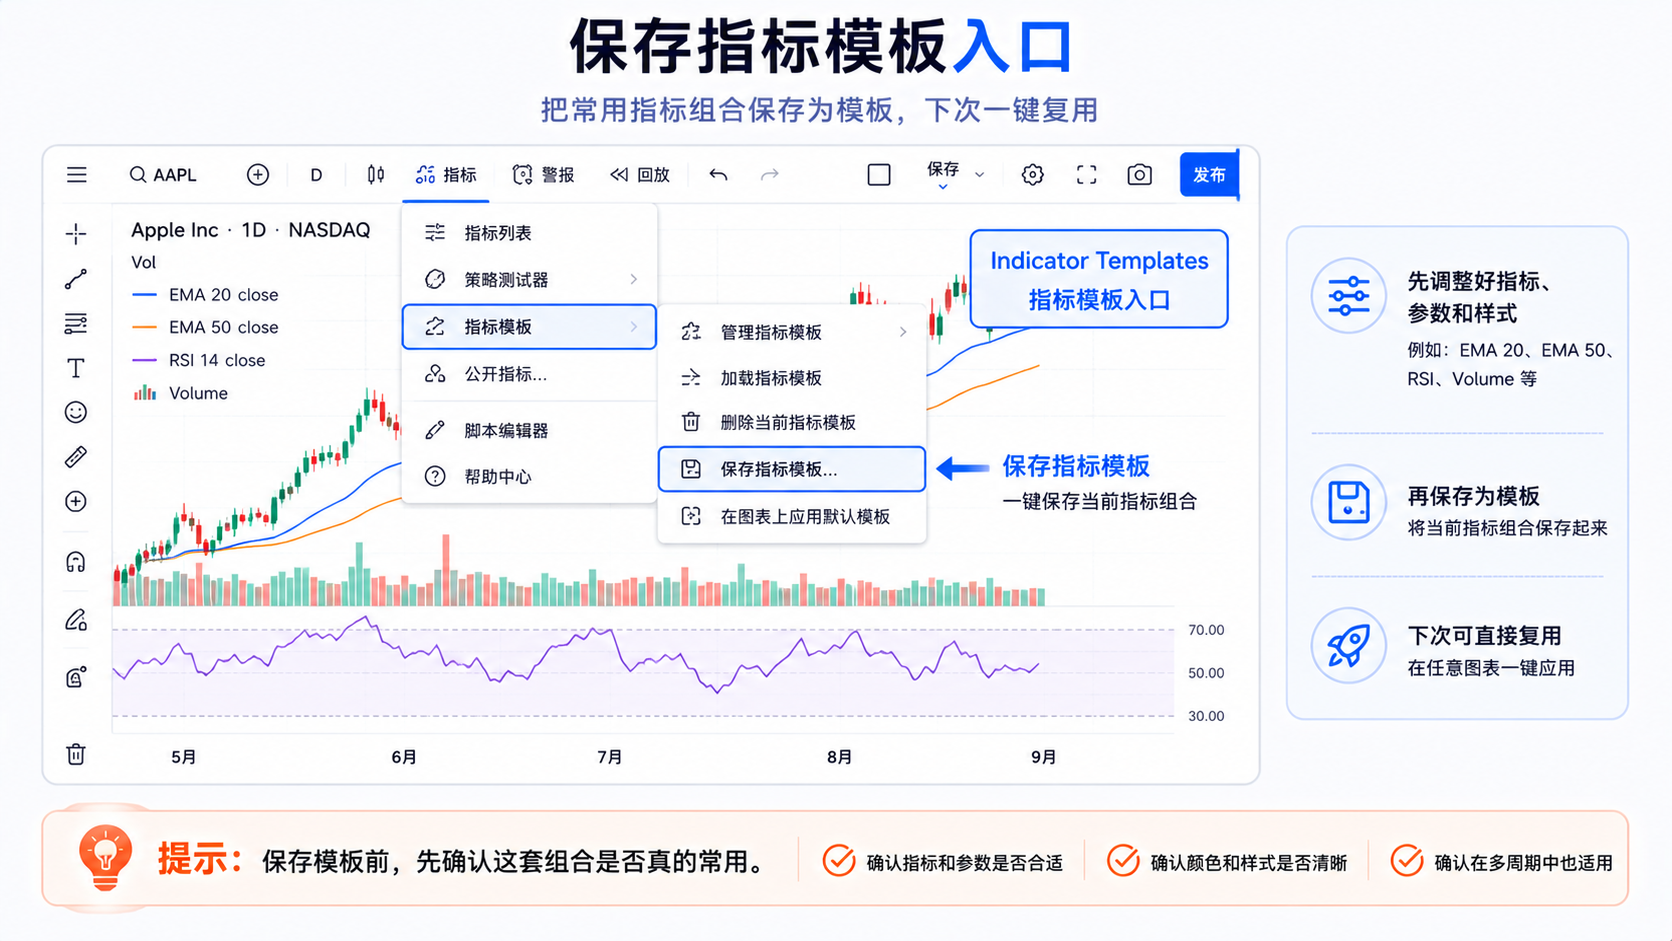
- Add your common indicators to the chart first — e.g. EMA 20, EMA 50, RSI 14, MACD, Volume. Think about the template's purpose first: trend, momentum, volume, or intraday review.
- Adjust parameters — MA periods, RSI length, MACD parameters, VWAP, volume colors, main/sub panel positions, and so on. Save after parameters are stable, avoiding a version for 14 today and 21 tomorrow.
- Adjust styles — colors, line width, labels, panel height. EMA colors too close or a cramped sub-panel hurt readability.
- Save as an Indicator Template — find the entry at the top of the chart or the indicator menu, and save with a clear name, e.g.
Trend watch | EMA20 EMA50 Volume. - Test whether it reuses well — apply it to another instrument and check the indicators, parameters, styles, and panels; VWAP and the like aren't necessarily right for all long-timeframe charts.
How to Apply an Indicator Template
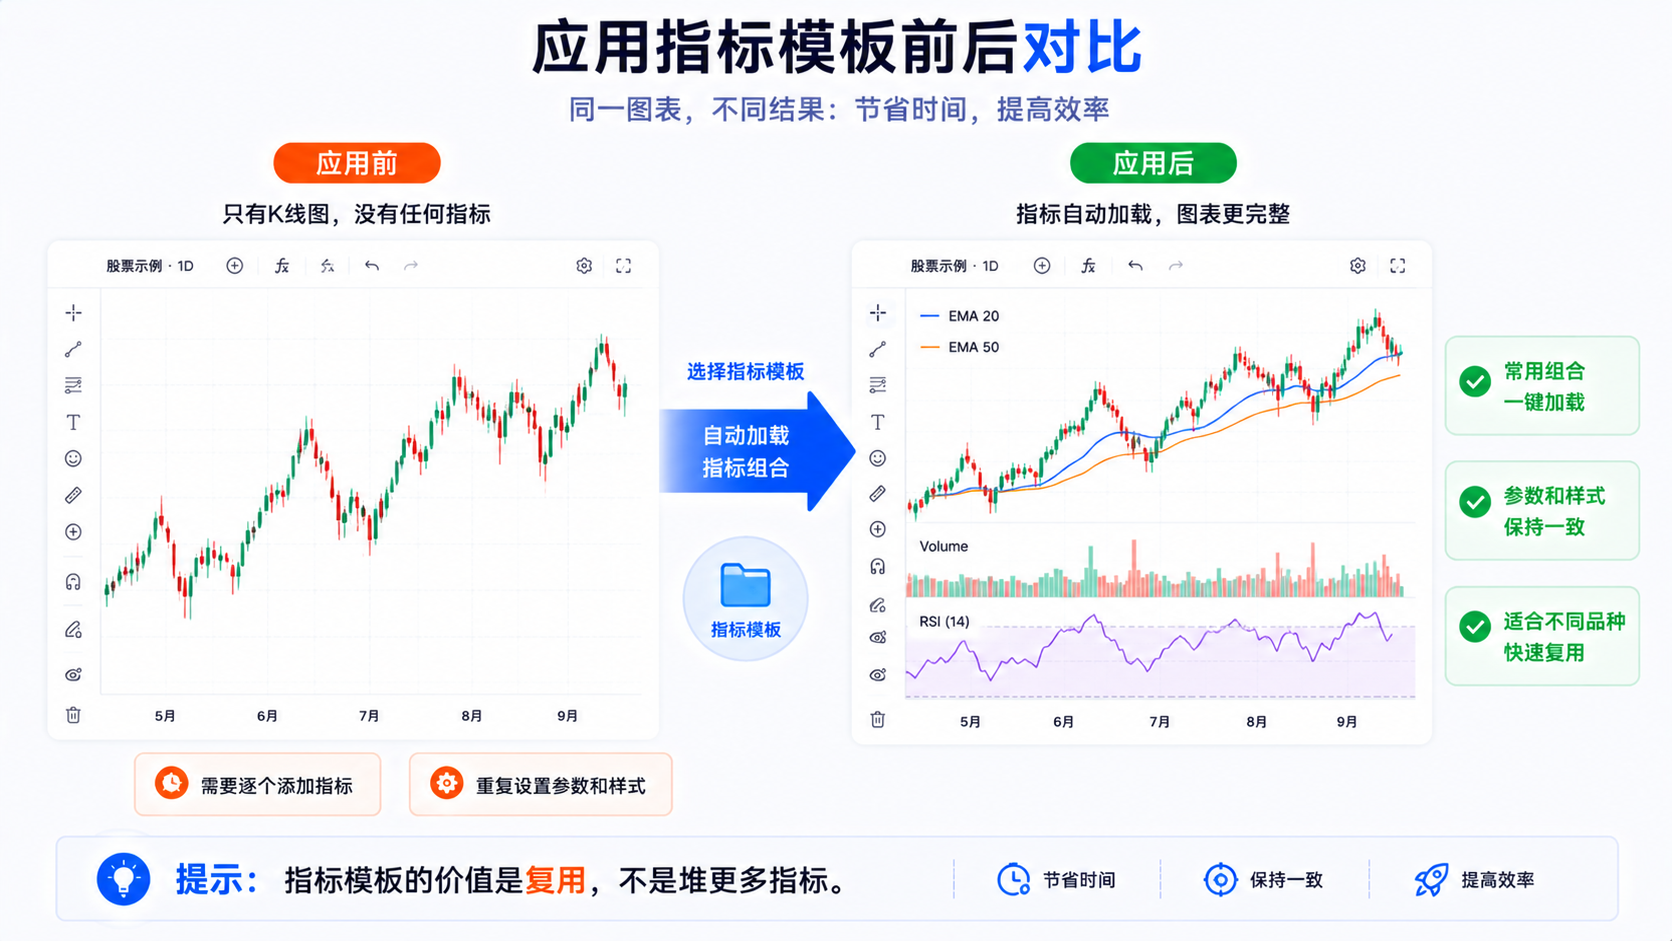
After opening a new chart, choose a saved template via the Indicator Templates menu, and the indicators load automatically.
Good for: switching to a new stock/crypto, comparing ETFs, batch reviews, restoring common indicators after switching devices, and so on.
Applying a template doesn't automatically make the chart suitable for analysis—different markets, timeframes, and assets still require you to judge whether the set fits. After applying, confirm the timeframe matches the template's design.
How to Edit an Indicator Template
Apply the template first, change indicators on the chart, then re-save (overwrite or save as new). Common edits: EMA periods, colors, MACD panel height, adding/removing indicators, renaming.
Don't overwrite by tweaking a bit every time you look at charts—that means the template isn't stable yet. For temporary tests, change the chart first, observe for a few days, then decide whether to formally save.
How to Delete Templates You Don't Need
Clean up regularly: names you can't understand, long-unused ones, duplicate indicators, mere old-parameter versions, ones overlapping with other templates, or ones whose purpose is unclear when opened—all can be deleted.
The truly common templates are often just 3–5. Before deleting, ask: what problem does it solve? Have I used it in the past month? How does it differ from other templates?
What to Note When Saving Parameters and Styles
- Parameters don't update automatically — if you saved RSI 14 and later change it to 9, the template isn't auto-updated unless you re-save.
- Styles affect the experience — colors, line width, labels, and panel height all affect efficiency.
- Different instruments may need different templates — stocks, crypto, forex, and indices don't share identical logic.
- Distinguish main and sub panels — EMA and VWAP are mostly on the main chart; RSI, MACD, and volume are mostly on sub-panels, to avoid a cramped chart.
3 Indicator Templates Suitable for Beginners
The following are observation frameworks, not trading strategies, and don't indicate whether to buy or sell.
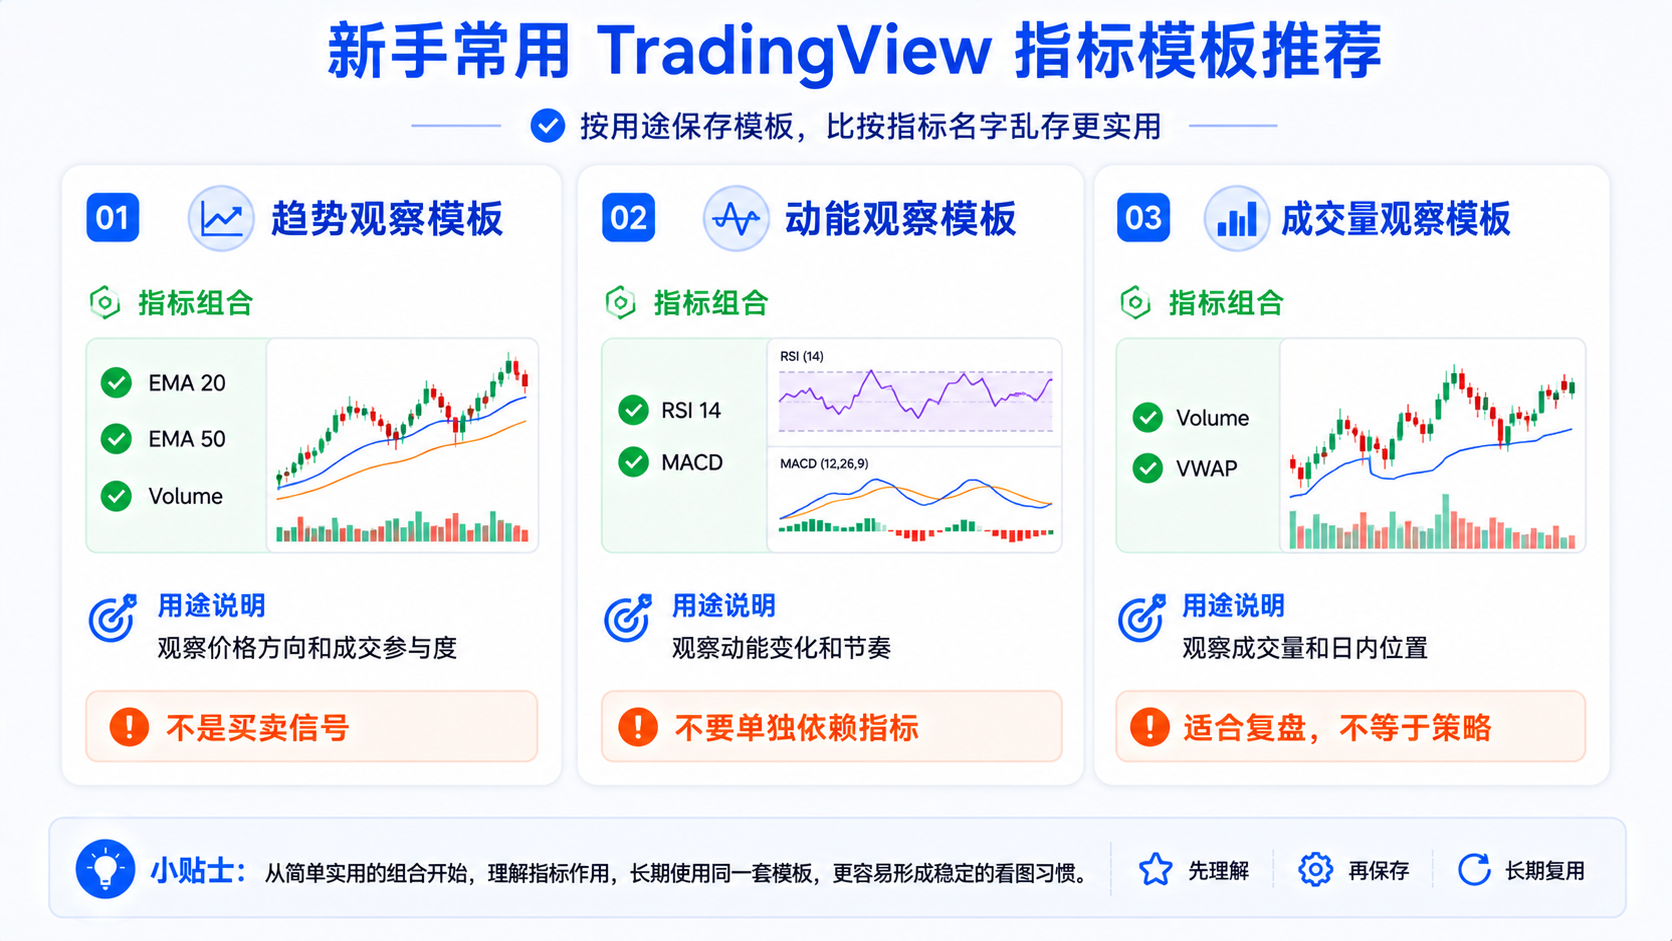
Template 1: Trend Watch Template
Suggested combo: EMA 20, EMA 50, Volume.
Good for observing: roughly what trend environment the price is in; MAs show relative position, volume shows participation.
Note: don't treat a MA cross as an inevitable signal; EMA is only an observation aid.
Naming example: Trend watch | EMA20 EMA50 Volume
Template 2: Momentum Watch Template
Suggested combo: RSI 14, MACD; you can keep one EMA on the main chart.
Good for observing: momentum changes; RSI shows strength/weakness zones, MACD shows trend momentum.
Note: a high RSI doesn't mean an immediate drop, and a low one doesn't mean an immediate rise; MACD lags.
Naming example: Momentum watch | RSI14 MACD
Template 3: Volume Watch Template
Suggested combo: Volume, Volume MA, VWAP; optionally draw key horizontal lines by hand.
Good for observing: whether price moves have volume behind them, especially in intraday review or around news.
Note: higher volume only means more participation; VWAP is a reference line, not a buy/sell signal.
Naming example: Volume watch | Volume VWAP
Common Mistakes: Why Templates Get Messier as You Save
Mistake 1: Saving a Template Every Time You Change a Parameter
Test for stability first, then save a formal version.
Mistake 2: Careless Template Names
Names should state the purpose, e.g. Trend watch | EMA20 EMA50 Volume.
Mistake 3: Treating a Template as a Trading Strategy
A template doesn't tell you to buy or sell automatically, nor guarantee a signal works.
Mistake 4: One Template to Solve Everything
Split by purpose; don't pile all indicators onto one chart.
Mistake 5: Not Checking the Timeframe After Applying
EMA 20 means completely different things on 5m vs daily; always confirm the timeframe after applying.
A More Practical Template-Organizing Method
Keep it to 3–5, named by purpose:
Trend watch | EMA20 EMA50 VolumeMomentum watch | RSI14 MACDVolume watch | Volume VWAPIntraday review | VWAP Volume RSILong-term watch | EMA50 EMA200 Volume
When you open the template menu, you'll know at a glance which to choose.
Summary: Templates Tidy Your Chart Toolbox, Not Make More Indicators
Indicator templates spare you from re-adding the same set every time. More isn't better—each should have a clear purpose, a clear name, stable parameters, and a clean chart, so you get into observation mode faster instead of making the chart look more complex.
FAQ
What are TradingView indicator templates?
They save common indicators, parameters, and some styles so you can quickly apply them to other charts without adding and tuning each one every time.
What's the difference between an indicator template and a chart layout?
A template saves the indicator combo and styles; a layout saves a more complete workspace. Use a template to reuse indicators, and a layout to save your whole watching environment.
Do TradingView indicator templates save parameters?
They usually save the parameters and some styles at the time; temporary changes on the chart won't auto-update the template—you need to re-save.
Which indicator templates should a beginner save?
Three kinds are recommended: trend (EMA + volume), momentum (RSI + MACD), and volume (Volume + VWAP). Don't save too many at the start.
Can an indicator template be used as a trading strategy?
No. A template is only for reusing indicator combos and aiding observation; it can't replace a trading plan, risk control, and review.