Strategy & Backtest · Advanced
TradingView Strategy Properties: Initial Capital, Commission, Slippage, and Position Size
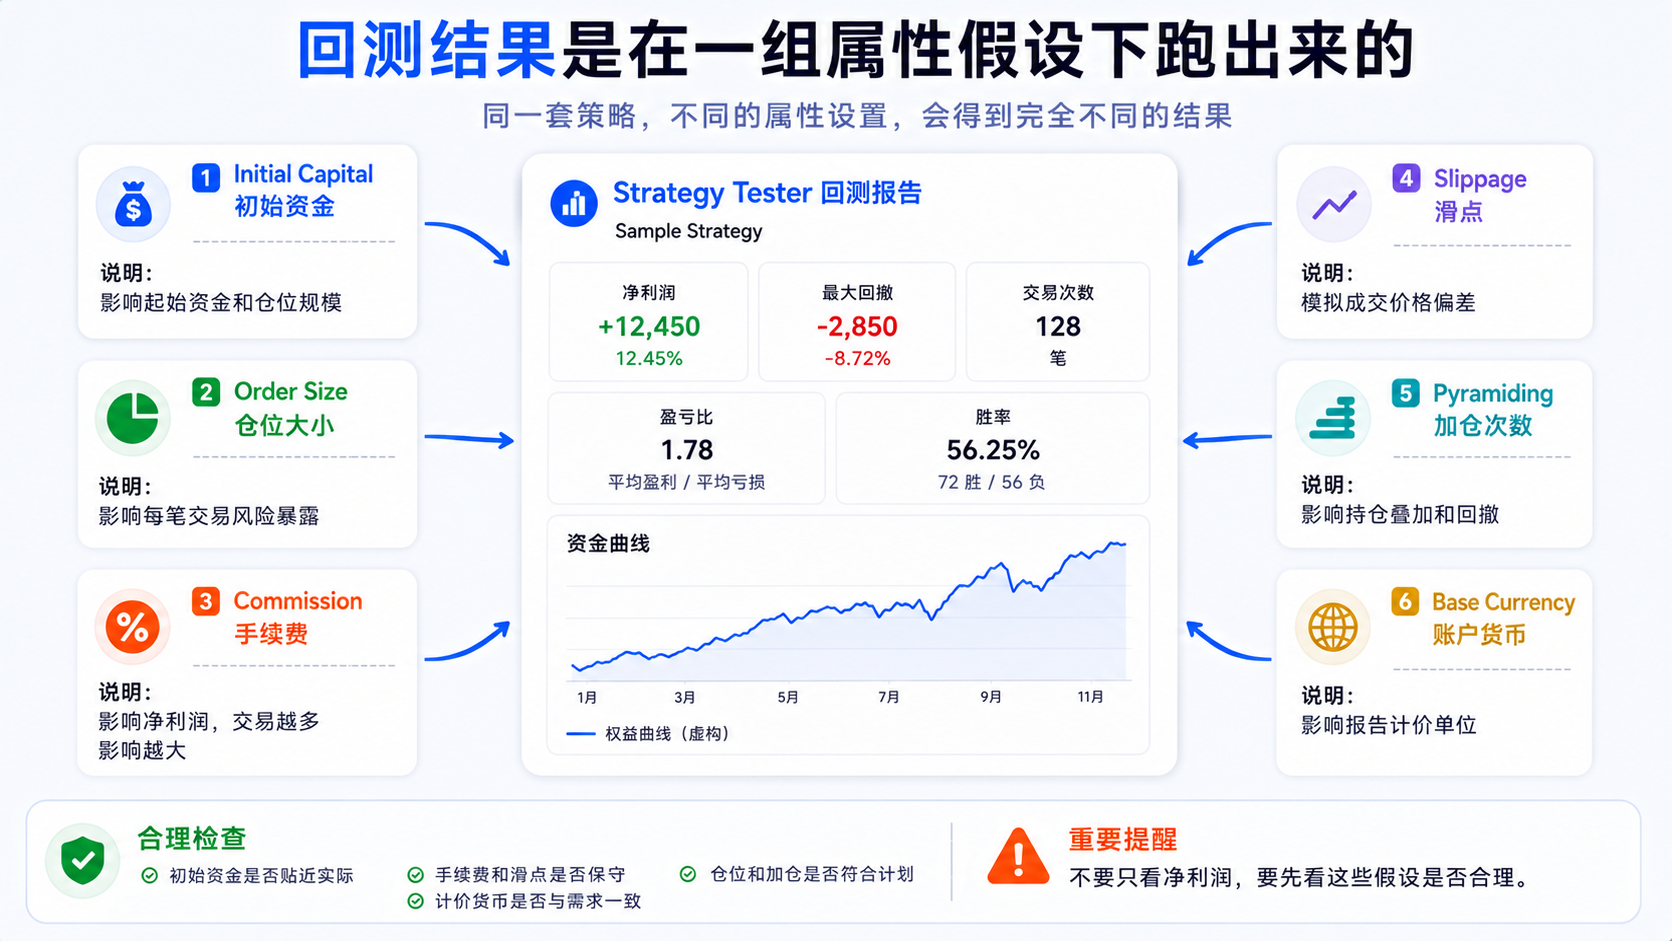
The first time you run a strategy backtest on TradingView and see a positive net profit and a beautiful equity curve, it's easy to get excited—but if you never open Strategy Properties, the default initial capital, default position size, zero commission, and zero slippage usually look far better than the real environment. When looking at the Strategy Tester, ask first: under what assumptions was this result produced?
Bottom Line First: Strategy Properties Affect Backtest Credibility
Strategy Properties are not optional settings. The fields listed in official docs and the Pine Script docs—initial capital, base currency, order size, pyramiding, commission, slippage, margin, and so on—directly affect how much capital each trade uses, whether it compounds, whether costs are included, whether fills are too idealized, whether it can add to positions repeatedly, and whether drawdown is underestimated.
Many pretty backtests aren't necessarily strong logic—they may just be an overly ideal backtest environment. With no commission or slippage and aggressive sizing, historical performance deserves a question mark.
Where Do You Open Strategy Properties?
- Open a TradingView chart;
- Add a Pine Script strategy (not an ordinary indicator);
- Open the Strategy Tester at the bottom;
- Click settings next to the strategy name to enter Settings;
- Switch to the Properties tab.
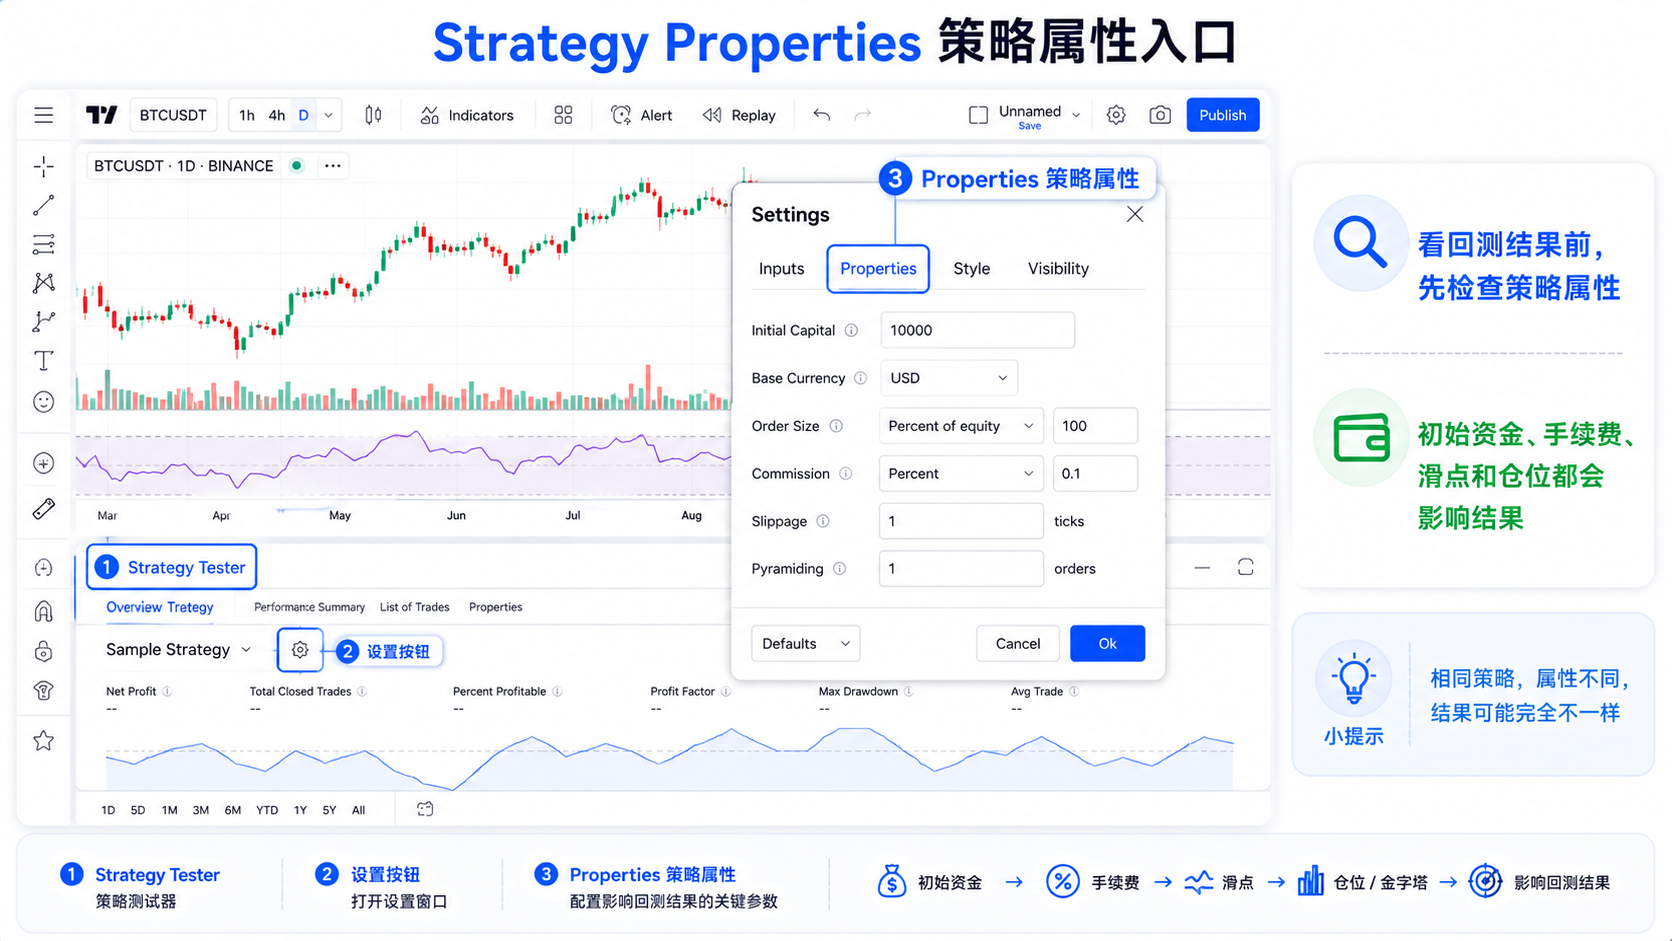
Button positions may vary by interface version. A common beginner misunderstanding: only strategy()-type scripts generate a trade list and backtest report in the Strategy Tester; ordinary indicators can't replace strategy backtesting.
Initial Capital: What Does It Mean?
Initial Capital is the money in the simulated account when the backtest starts. Set 10,000 and it starts from ten thousand; set 100,000 and it starts from a hundred thousand.
The effect is more obvious when Order Size uses a percent of equity—for example 10% of equity: with 10,000 initial, each trade is about 1,000; with 100,000 initial, about 10,000; if compounding is allowed, subsequent sizes grow as the account grows.
Don't use an oversized initial capital just to make the net-profit number look better—simulate a reasonable account size.
Base Currency: What Does It Mean?
Base Currency is the account pricing currency used by the backtest report (e.g. USD, EUR, USDT), affecting how amounts are displayed.
The chart price unit, the account base currency, and the instrument's contract unit may not be the same thing. While learning, understand it first as "what currency the report is priced in"; more serious backtests need to confirm that the instrument, exchange, and currency match.
Order Size: How to Understand Position Size
Order Size determines how large each trade's position is—one of the fields that most easily changes results. Common methods include:
- Fixed quantity — e.g. 1 share/1 contract each time; simple, but the impact differs greatly across assets at different prices;
- Fixed amount — e.g. 1,000 dollars each time; the notional size is stable, and the quantity bought changes with price;
- Percent of equity — e.g. 10% of equity each time; has a compounding effect, and both returns and drawdown change with equity;
- a quantity specified inside the script, and so on.
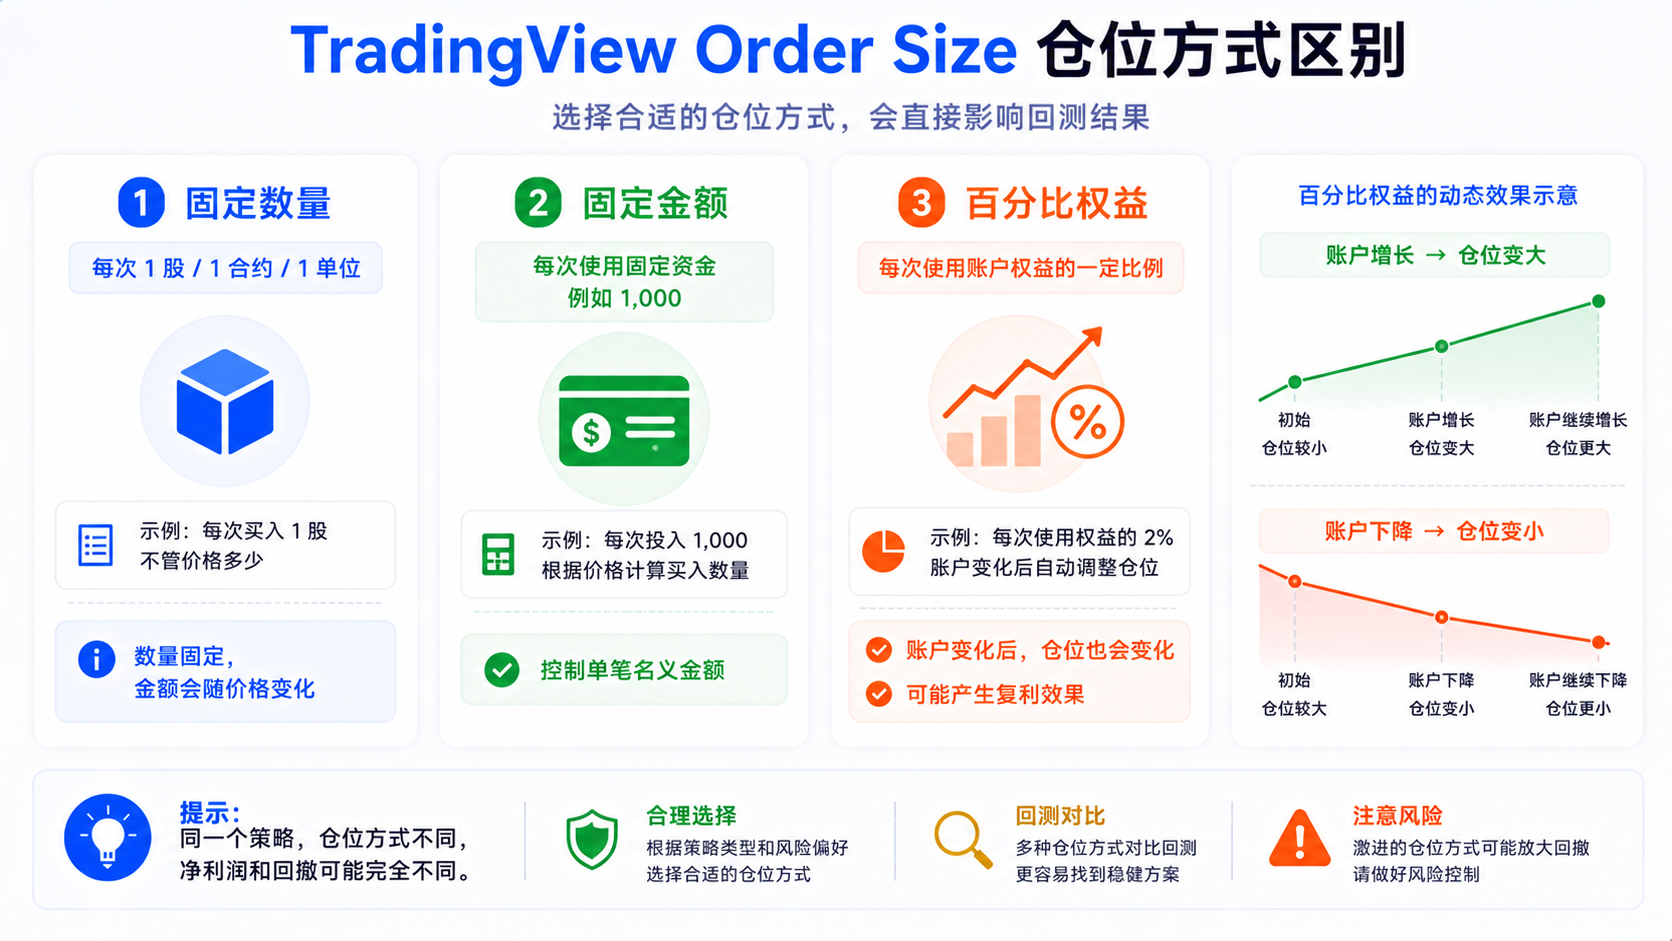
The same strategy can produce completely different net profit and drawdown with different Order Sizes. Percentage sizing isn't wrong, but be aware of the compounding effect.
Commission: Why It Matters
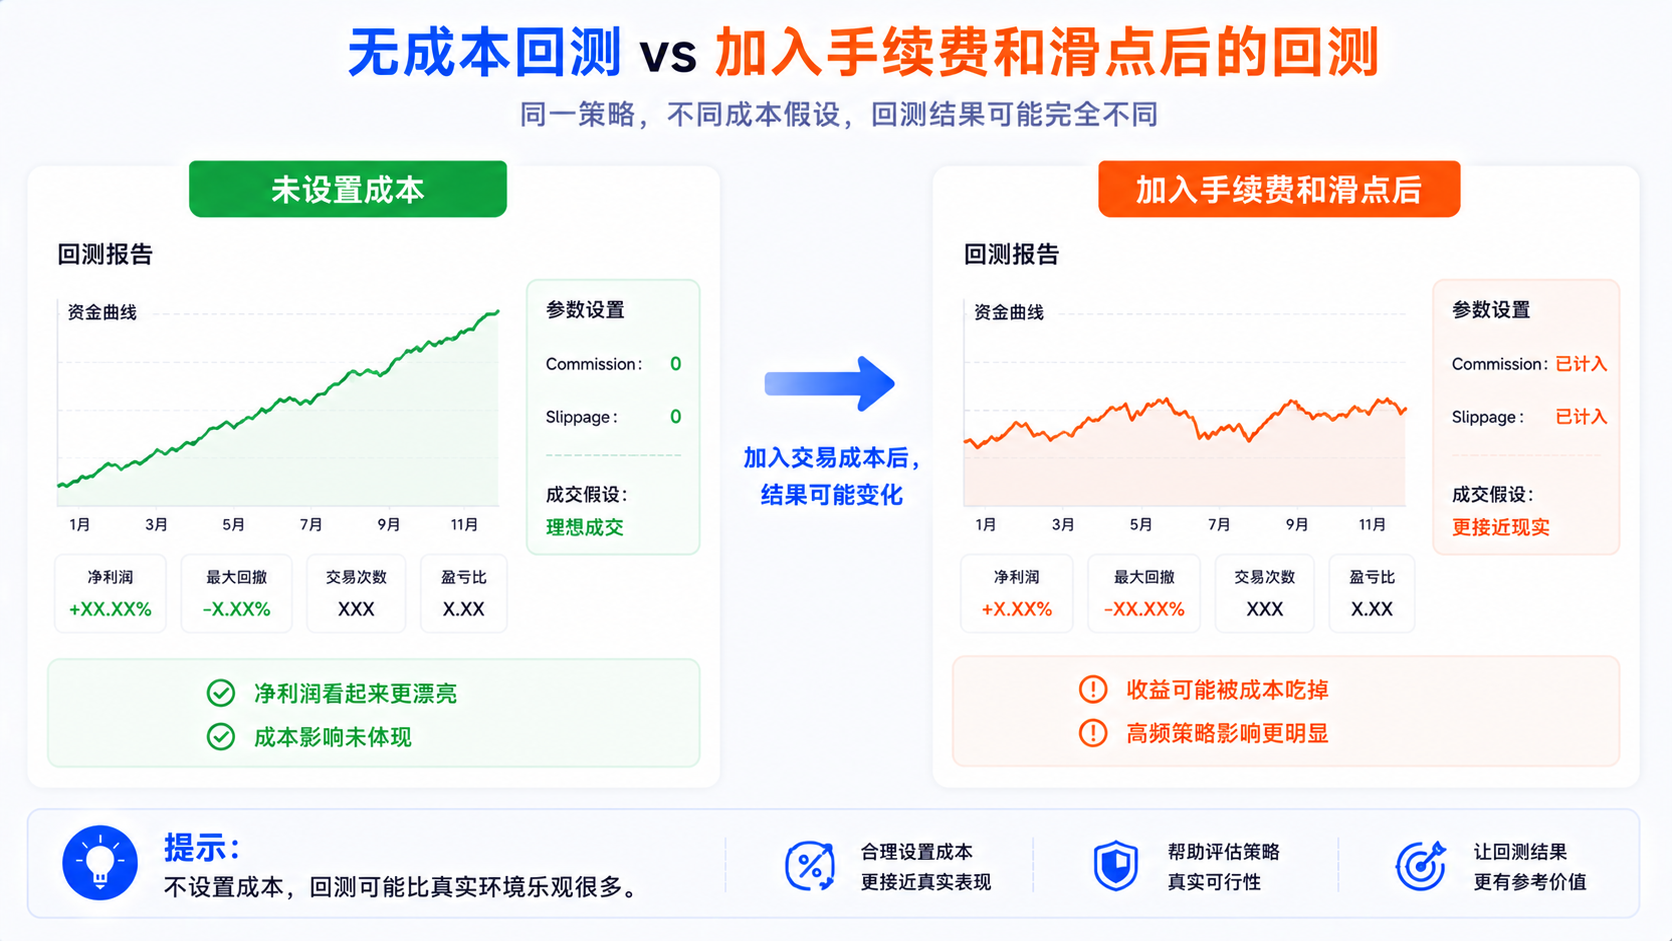
When trades are few, commission may have little impact; when trading frequently, commission can directly decide profit or loss. TradingView can set Commission as: a percent of turnover, a fixed amount per order, or a fixed amount per contract.
Strategies with thin per-trade profit are especially dangerous: the curve may look great with no commission, but after adding costs, profit can be eaten up or even go negative. Before looking at a backtest, ask: is the frequency high? Can per-trade profit cover the commission? Is it simulated against the real market?
Slippage: What Does It Mean?
Slippage simulates a fill price slightly worse than the ideal price. In official docs, slippage is added in ticks to the fill price of market or stop orders to account for factors like the spread.
Real trading has latency, spread, and liquidity issues. Slippage especially affects high-frequency, breakout, market-order, high-volatility, or low-liquidity instruments. In a backtest you enter precisely; in live trading it may be a bit off, and over many trades the difference accumulates.
Pyramiding: What Does the Add-On Count Mean?
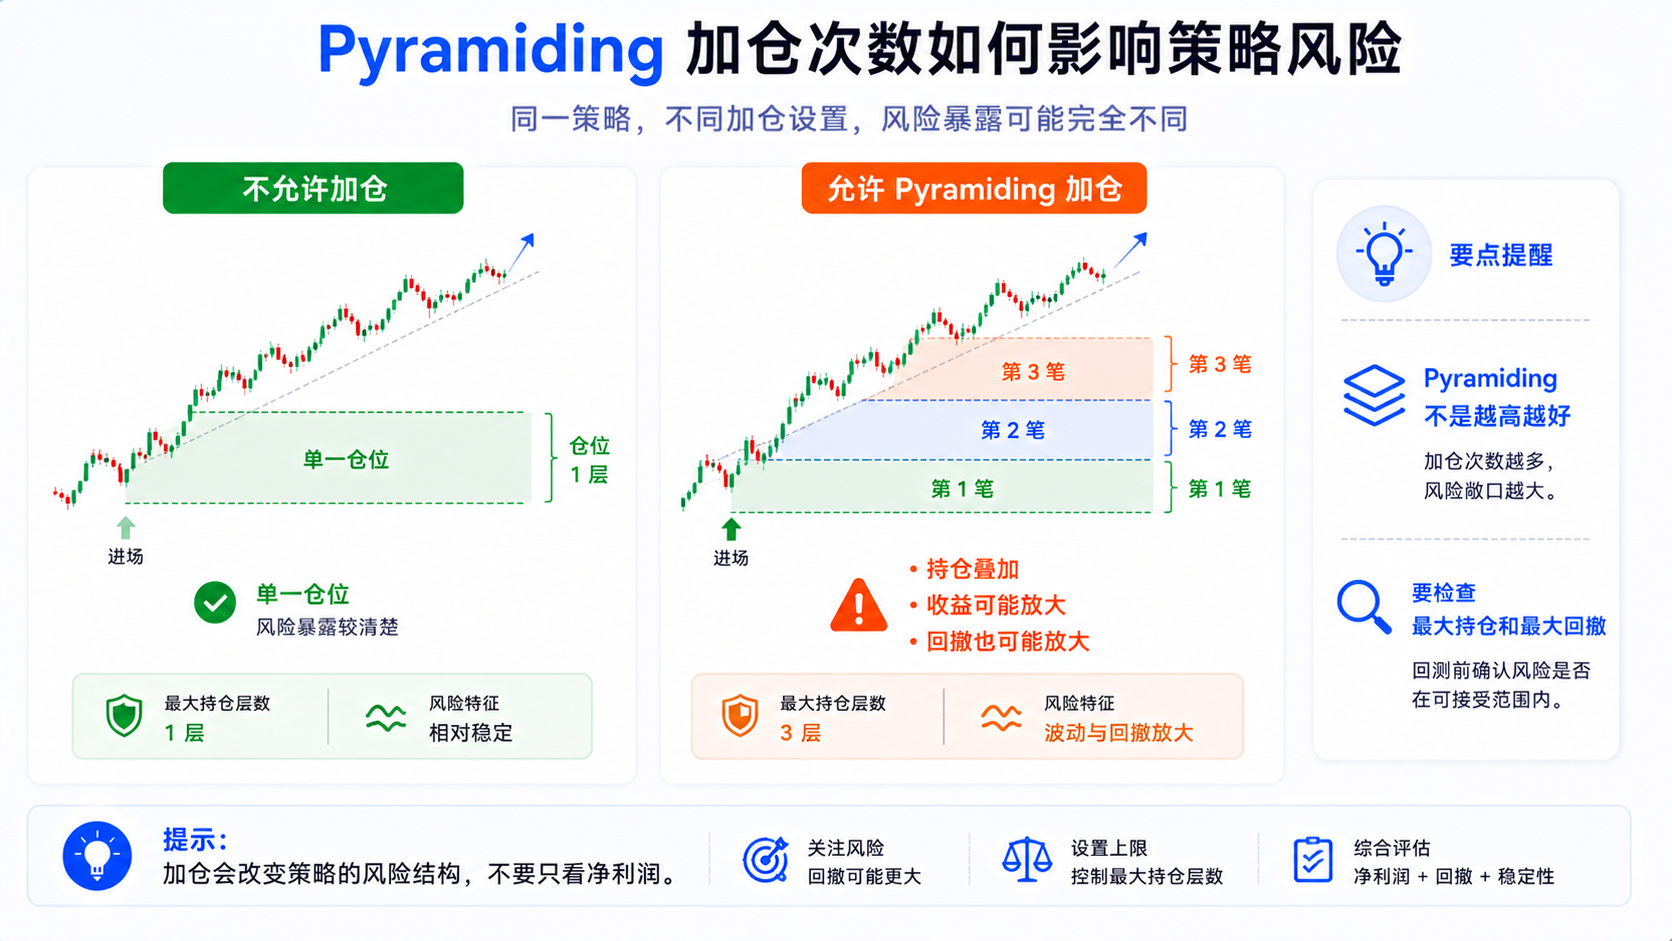
Pyramiding is whether adding to a position in the same direction is allowed. When not allowed, an existing position won't be stacked; when greater than 0, you can keep adding to an existing position, affecting risk exposure.
Adding can amplify profit and also amplify drawdown. Ask: does it re-enter repeatedly? How many layers at most in the same direction? How large is the max position? Is drawdown amplified as a result?
How Does Each Parameter Affect the Backtest?
| Parameter | What it affects | What beginners overlook |
|---|---|---|
| Initial Capital | Starting capital, position size, equity curve | Oversized initial capital makes net profit look better |
| Base Currency | Report pricing currency | Price unit, account currency, and contract unit may differ |
| Order Size | Size of each position | Percentage sizing brings a compounding effect |
| Commission | Cost per trade | High-frequency strategies are most easily eaten by commission |
| Slippage | Simulated fill-price deviation | Backtest fills are usually more ideal than real fills |
| Pyramiding | Whether same-direction adds are allowed | Adding can amplify both returns and drawdown |
Change one field and net profit, drawdown, number of trades, win rate, and profit factor can all change—the result is produced by these assumptions together.
Settings Beginners Overlook Most
1. Commission
Not setting commission makes results too ideal, with the biggest impact on short-term and high-frequency strategies.
2. Slippage
Not setting slippage assumes very ideal fills; the more you rely on precise entries, the more it matters.
3. Position Ratio
An oversized Order Size can make the return number look good while amplifying drawdown; percent of equity also has a compounding effect.
4. Pyramiding
When adding is allowed, you must look at the max risk exposure, not just net profit.
Setting Ideas for Different Strategy Types
The following doesn't recommend specific parameters, only directions to check.
Low-Frequency Strategies
Few trades (e.g. daily/weekly trend). Focus: whether initial capital is reasonable, whether sizing fits the logic, whether commission and slippage are set, whether the sample is long enough, and whether the drawdown is acceptable. Cost impact is relatively small, but can't be fully ignored.
Medium-Frequency Strategies
Adjustments over days to weeks or hourly. Focus: whether commission noticeably erodes profit, whether slippage affects entries/exits, whether sizing is too large, whether pyramiding is allowed, and whether it's stable across market conditions. It often shows "fine without costs, mediocre with costs".
High-Frequency or Short-Term Strategies
Requires the most caution. Focus: commission, slippage, spread, fill assumptions, average profit per trade, number of trades, and whether it's overfit. When each trade earns just a little but you trade hundreds or thousands of times a year, cost is the core issue; not setting costs clearly lowers credibility. Combine with timeframes to understand how trading frequency differs by period.
Common Misconceptions: Why Backtest Results Get Prettified
Misconception 1: Trust the Default Settings Directly
Looking only at the report after adding a strategy, not the Properties—defaults are just assumptions, not the real world.
Misconception 2: Sizing Too Large
The larger the size, the easier the numbers look good, and the easier drawdown grows.
Misconception 3: Ignoring the Compounding Effect
Percent of equity automatically scales the size with equity; later returns and the drawdown shape both change.
Misconception 4: Not Setting Commission and Slippage
The most typical form of prettification.
Misconception 5: Tuning Properties to Look Best
Constantly changing parameters just for a pretty report isn't a more realistic strategy evaluation.
A More Reliable Strategy-Properties Check Flow
- Check Initial Capital first, confirming the account-size assumption;
- Then Base Currency, confirming the report pricing;
- Check Order Size, confirming the per-trade sizing method;
- Set or check Commission;
- Set or check Slippage;
- Check whether Pyramiding allows adding;
- Go back to the Strategy Tester and look at net profit, drawdown, and number of trades;
- Look at the List of Trades to confirm whether per-trade profit covers costs;
- Re-observe after changing cost assumptions;
- Don't look only at the prettiest set of settings.
The goal isn't to make the backtest ugly, but to bring it closer to reality. If you use indicators to help judge, keep charts consistent with indicator templates, then separately verify the strategy properties.
Summary: Don't Just Look at the Backtest Result, Look at the Assumptions Behind It
Initial Capital, Base Currency, Order Size, Commission, Slippage, and Pyramiding all affect Strategy Tester performance. A strategy with no costs and oversized sizing may have a beautiful curve, which doesn't mean it can be replicated live.
A more mature approach: check strategy properties first, then look at the report; understand the assumptions first, then discuss results; look at costs and sizing first, then net profit. A backtest is understanding a strategy's performance under historical conditions and parameter assumptions—not proof that it will make money.
FAQ
Where do you open TradingView Strategy Properties?
After adding a Pine Script strategy, open the Strategy Tester and go to Settings → Properties next to the strategy name. Ordinary indicators don't have full strategy-backtest properties.
Does Initial Capital affect backtest results?
Yes. It determines the starting capital size; when Order Size uses percent of equity, it also affects the notional size per trade and the compounded equity curve.
Must Commission and Slippage be set?
If you want to be closer to the real environment, set them carefully. Commission can be a percent of turnover, per order, or per contract; Slippage affects the fill price of market or stop orders in ticks.
What's the impact of choosing percent of equity for Order Size?
It produces compounding: as equity rises the size grows, as it falls the size shrinks, affecting net profit, drawdown, and the equity curve. Don't just see higher returns while ignoring amplified drawdown.
Is higher Pyramiding always better?
No. It only indicates whether you can keep adding in the same direction; it can amplify returns and also drawdown, so decide based on the strategy logic and risk control.