Drawing & Charts · Beginner
TradingView Object Tree: Organize Drawings, Annotations, and Indicators
When you first learn to draw on TradingView, you want to mark everything; open the chart a few days later and trend lines, rectangles, text, and indicators pile up until even you can't read it—the problem usually isn't that you can't draw, but that you didn't organize the chart. The Object Tree is the tool that helps you get drawings, annotations, indicators, and hidden objects back under control.
Bottom Line First: Drawing Is Only Step One; Organizing the Chart Matters More
Drawing is convenient, and easy to overdo: prior highs, support/resistance, channels, Fibonacci, text notes... If there are so many lines you have to guess their meaning, they've lost their purpose as markers.
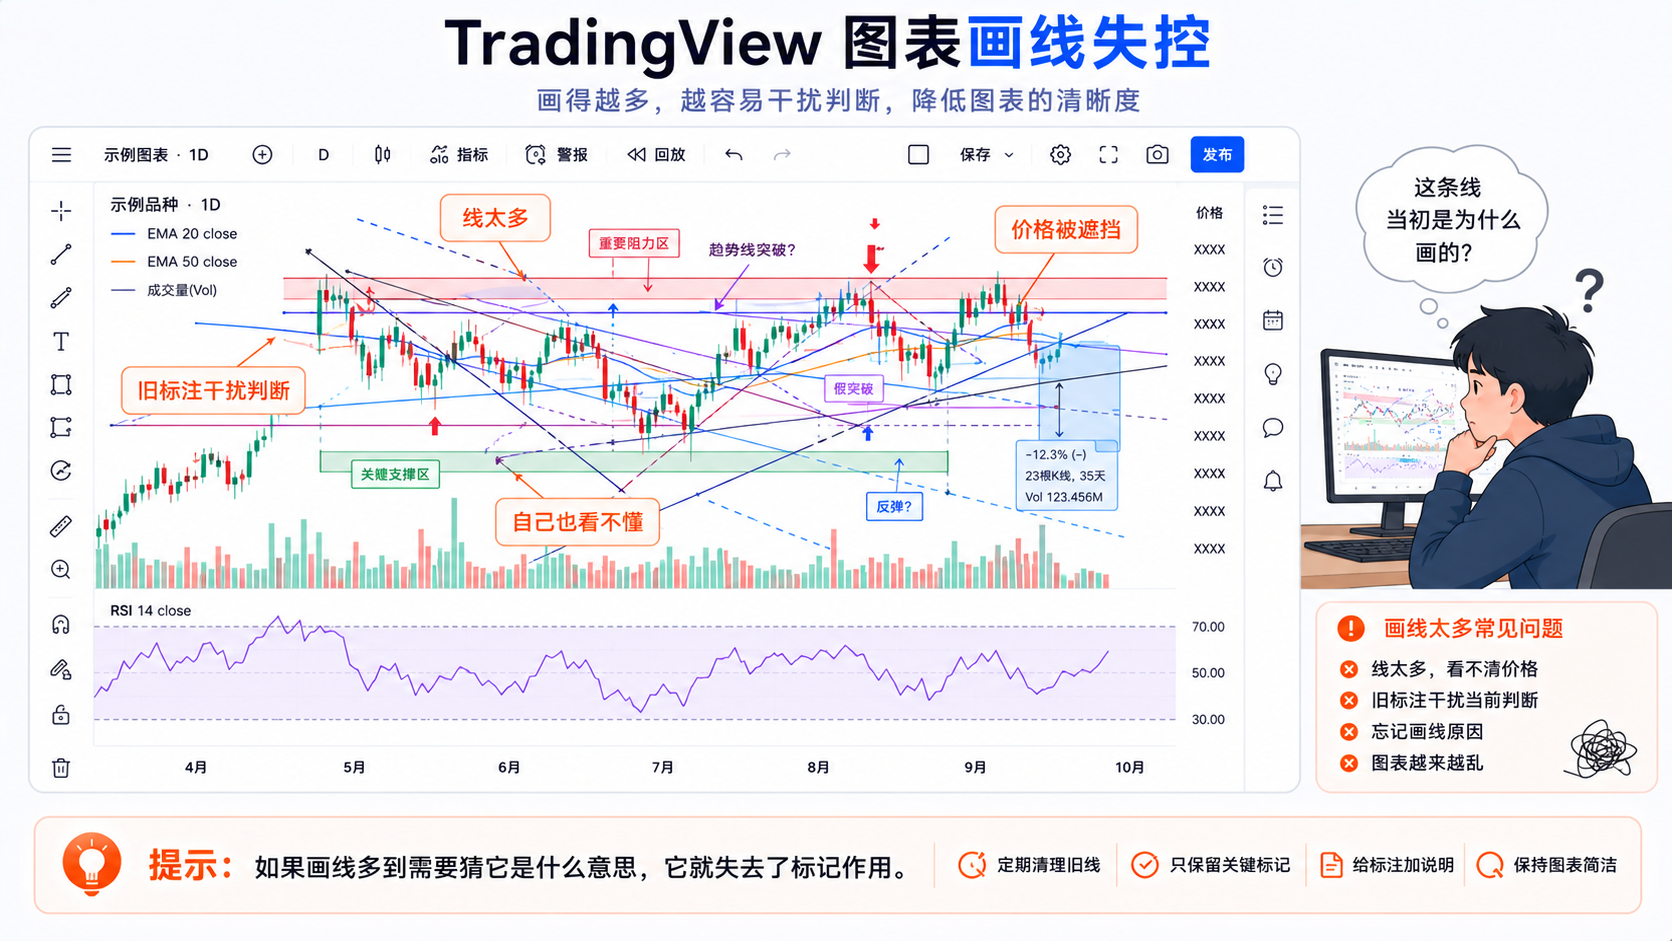
A good chart lets you see at a glance: the key areas, which lines are still valid, which are old reviews, and which indicators can be hidden for now. The Object Tree isn't to make the chart more complex, but to organize a complex chart clearly.
What Is the TradingView Object Tree?
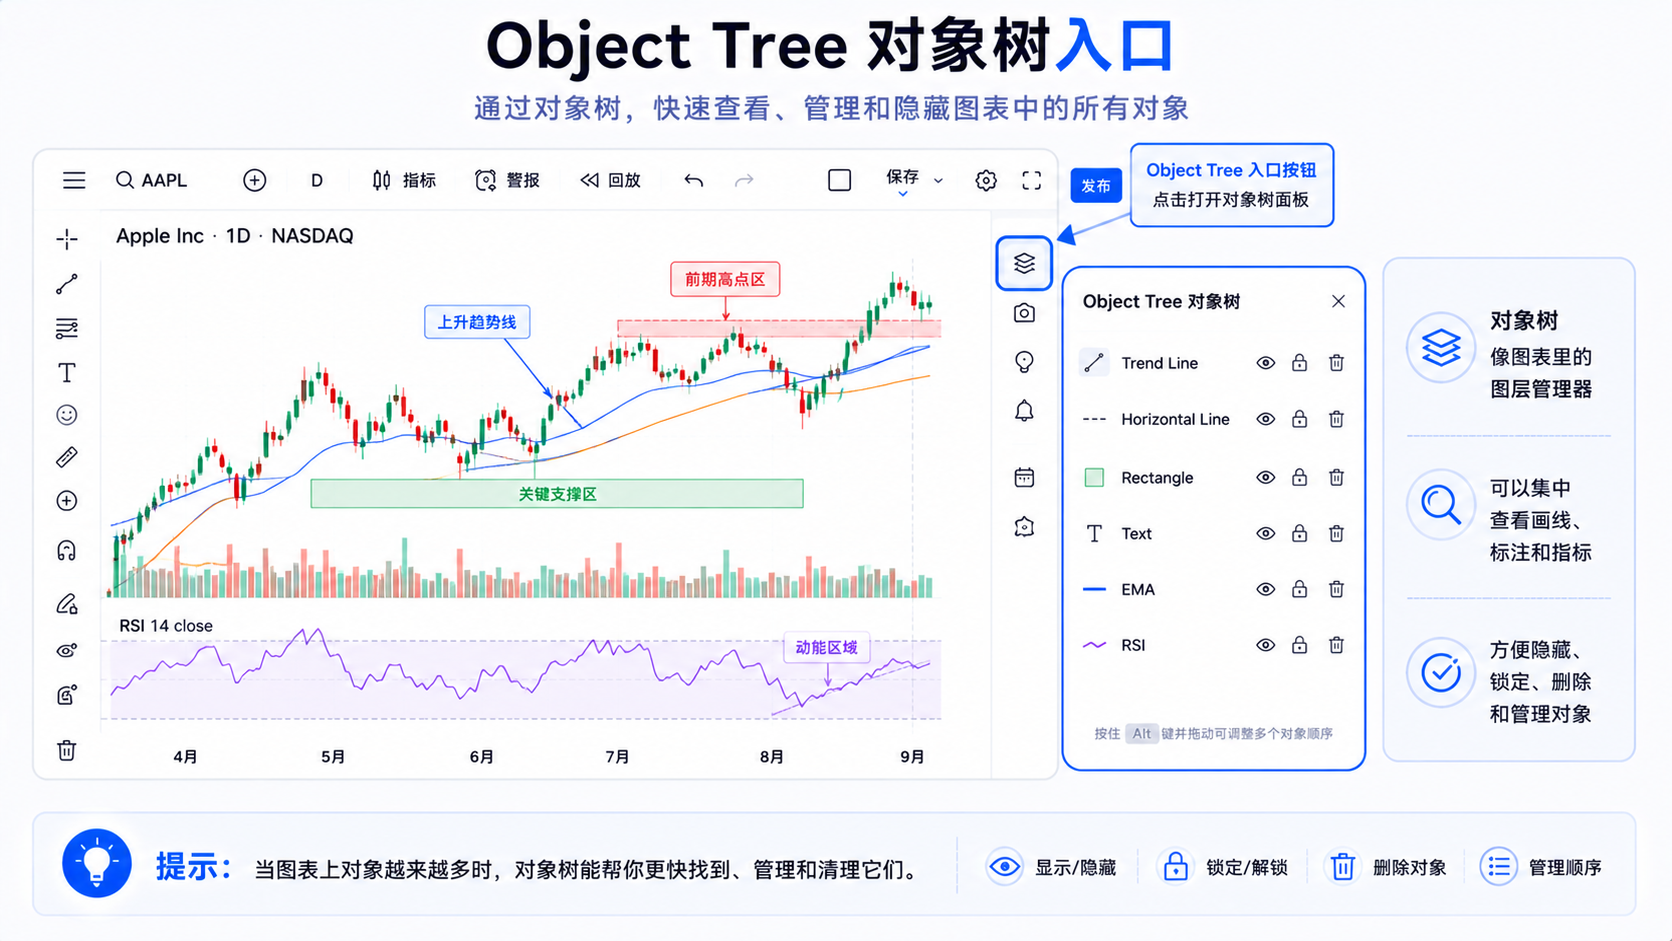
The Object Tree is a panel that centrally manages chart objects, similar to a layer manager in design software. Drawings, shapes, text, indicators, and so on are usually listed in the Object Tree, where you can view, hide, show, or delete them.
Official docs let you operate on drawings, indicators, and more via the Object Tree and Data Window button on the right. When the chart is clean the Object Tree isn't so important; when you've drawn a dozen lines, several rectangles, and several indicators, it's very useful.
What Can the Object Tree Manage?
1. Drawing Objects
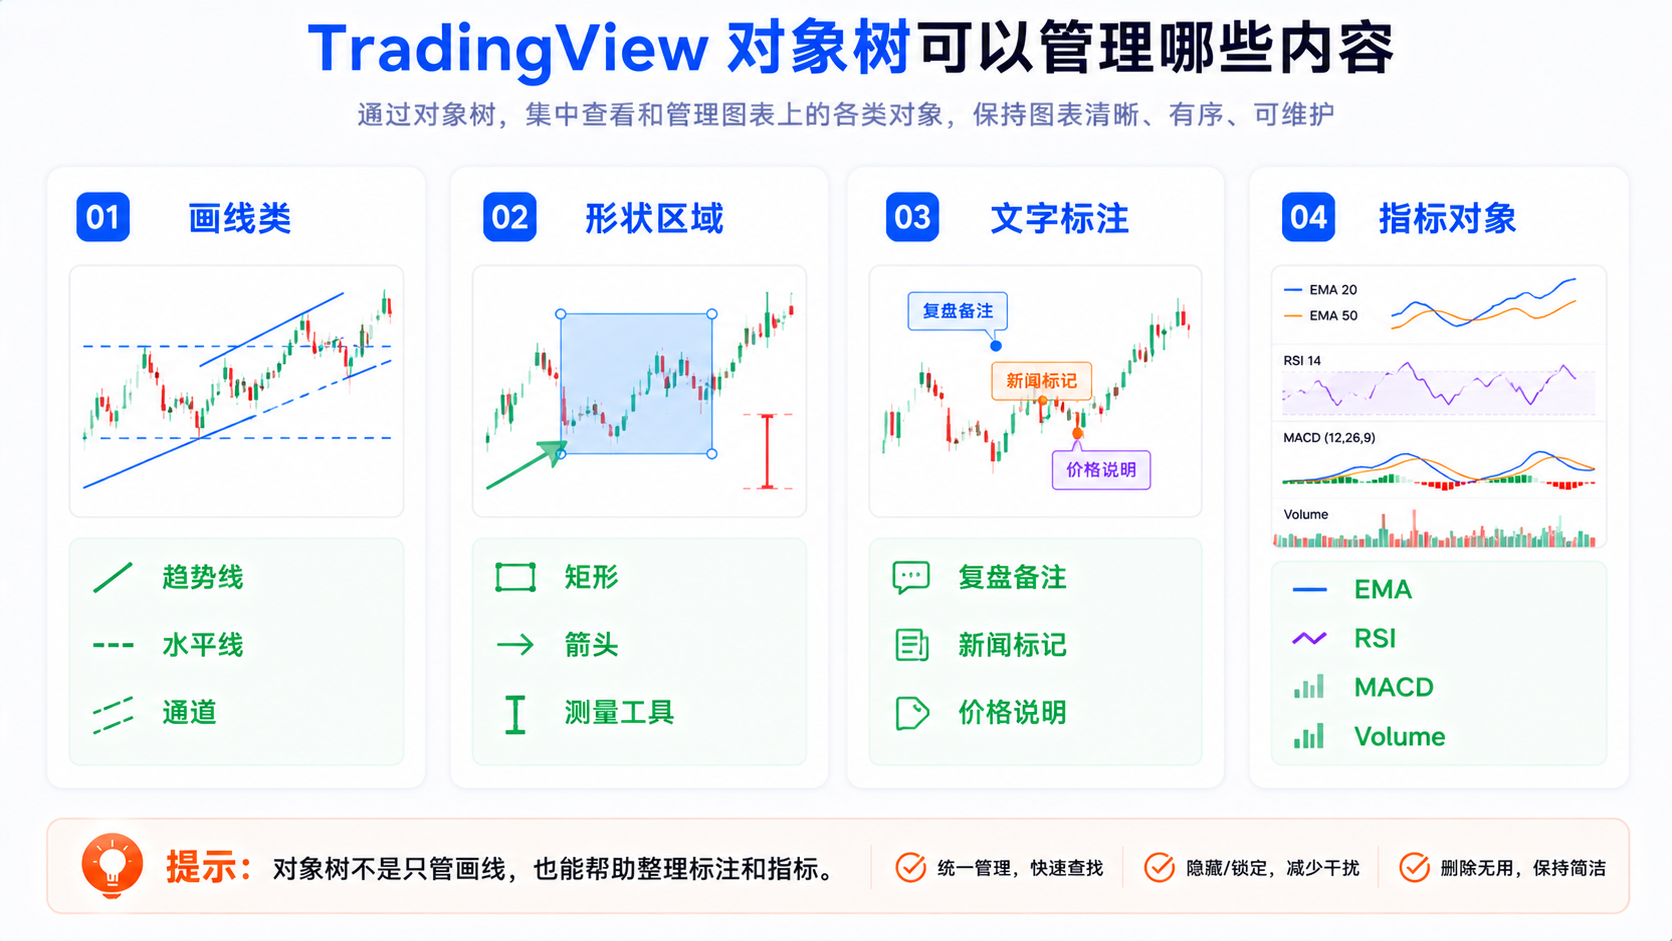
Trend lines, horizontal lines, vertical lines, parallel channels, rays, Fibonacci, and so on—the easiest to fill up a chart. When drawing across multiple timeframes, the Object Tree lets you view them together.
2. Shapes and Areas
Rectangles, circles, arrows, markers, measurement tools, range boxes, and so on. Good for marking key areas; too many block price, so hide them temporarily instead of deleting right away.
3. Text Annotations
Review notes, price explanations, news markers, plan reminders, and so on. Last week's "wait for a breakout" may be invalid this week and become clutter.
4. Indicators
EMA, RSI, MACD, Volume, VWAP, community indicators, and so on appear in the Object Tree. When there are too many, hide an indicator first. Combine with indicator templates to control the number of indicators.
5. Hidden Objects
Remember drawing a line but can't see it? It may be hidden. When you can't find a line, check the Object Tree first before redrawing.
How to Hide and Show Objects
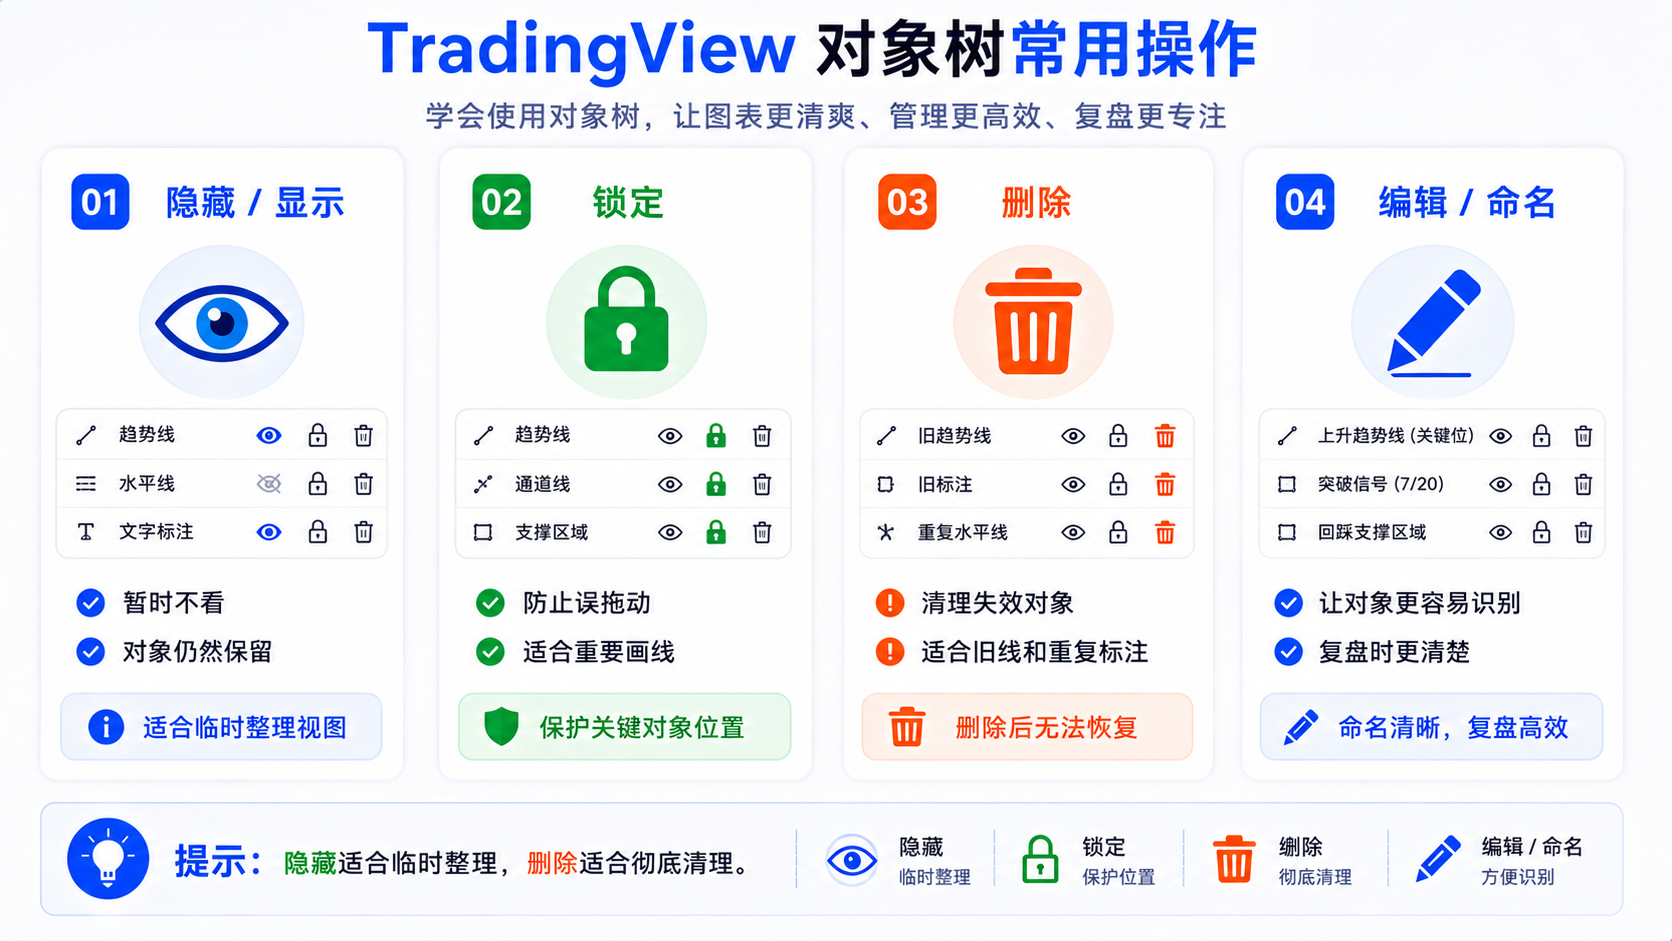
Hiding suits "don't want to see it for now, but don't want to delete yet": temporarily hide short-term lines, view naked candles, compare with and without indicators, take cleaner screenshots, and so on.
The Object Tree usually toggles visibility with an eye icon. Hiding isn't deleting—the object is still there, good for reviews where you hide first and open items one by one to verify.
How to Lock Objects
Locking suits protecting important drawings from accidental dragging—for example long-term support/resistance, higher-timeframe trend lines, important rectangles, and review baseline lines.
Locking mainly prevents mis-operations; it doesn't mean it can't be deleted; deleting a locked drawing may bring a confirmation dialog, and you can also adjust "Always remove locked drawings" in settings. Besides locking, important drawings should also be preserved via layout saving and regular organizing.
How to Delete Objects
Deleting suits content that's already invalid: expired short-term lines, rectangles the price has left, old text, test indicators, duplicate drawings, and old objects you don't understand.
When the chart is out of control, you can also use Remove Drawings & Indicators to clear everything at once—be very careful: first confirm whether there are important objects or locked items, and whether you need a screenshot or a saved layout.
How to Group or Organize Objects by Purpose
- Higher-timeframe objects — weekly resistance, daily support, major trend lines; name them like
HTF | Weekly resistance,HTF | Daily support zone. - Short-term watch objects — 15m trend lines, intraday rectangles; short-lived, name them like
Short | 15m downtrend line. - Review objects — news, false breakouts, high-volume levels; archive or delete after review, like
Review | Post-earnings gap. - Indicator objects — categorize by trend/momentum/volume; delete temporary test indicators when done.
When Should Beginners Clean Up Old Lines?
A chart isn't a warehouse. Judge by these criteria:
- The price left long ago, and the line no longer affects analysis;
- The observation goal is done (e.g. post-earnings volatility has been reviewed);
- You don't understand why you drew it;
- It duplicates another line—keep the clearest one;
- It blocks the current price and hampers reading candles.
Chart-Organizing Flow for Reviews
- Hide all short-term objects first — look at relatively clean price first.
- Show only key higher-timeframe objects — long-term support/resistance, major trend lines; combine with multiple timeframes to see the backdrop from a higher timeframe.
- Show the current review objects — only open the annotations needed this time, not all old ones at once.
- Delete invalid objects — meaningless short-term lines, expired text, duplicate rectangles, temporary tools, abandoned indicators.
- Keep valuable annotations — higher-timeframe areas, major events, classic mistake cases, and name them clearly.
- Save the layout — save after organizing, not when it's messiest.
A Practical Object-Naming Method
Recommended format: Purpose | Timeframe | Content
HTF | 1D | Prior-high resistance zoneShort | 15m | Downtrend lineReview | Post-earnings | Price gapTest | Indicator | Temporary RSI settings
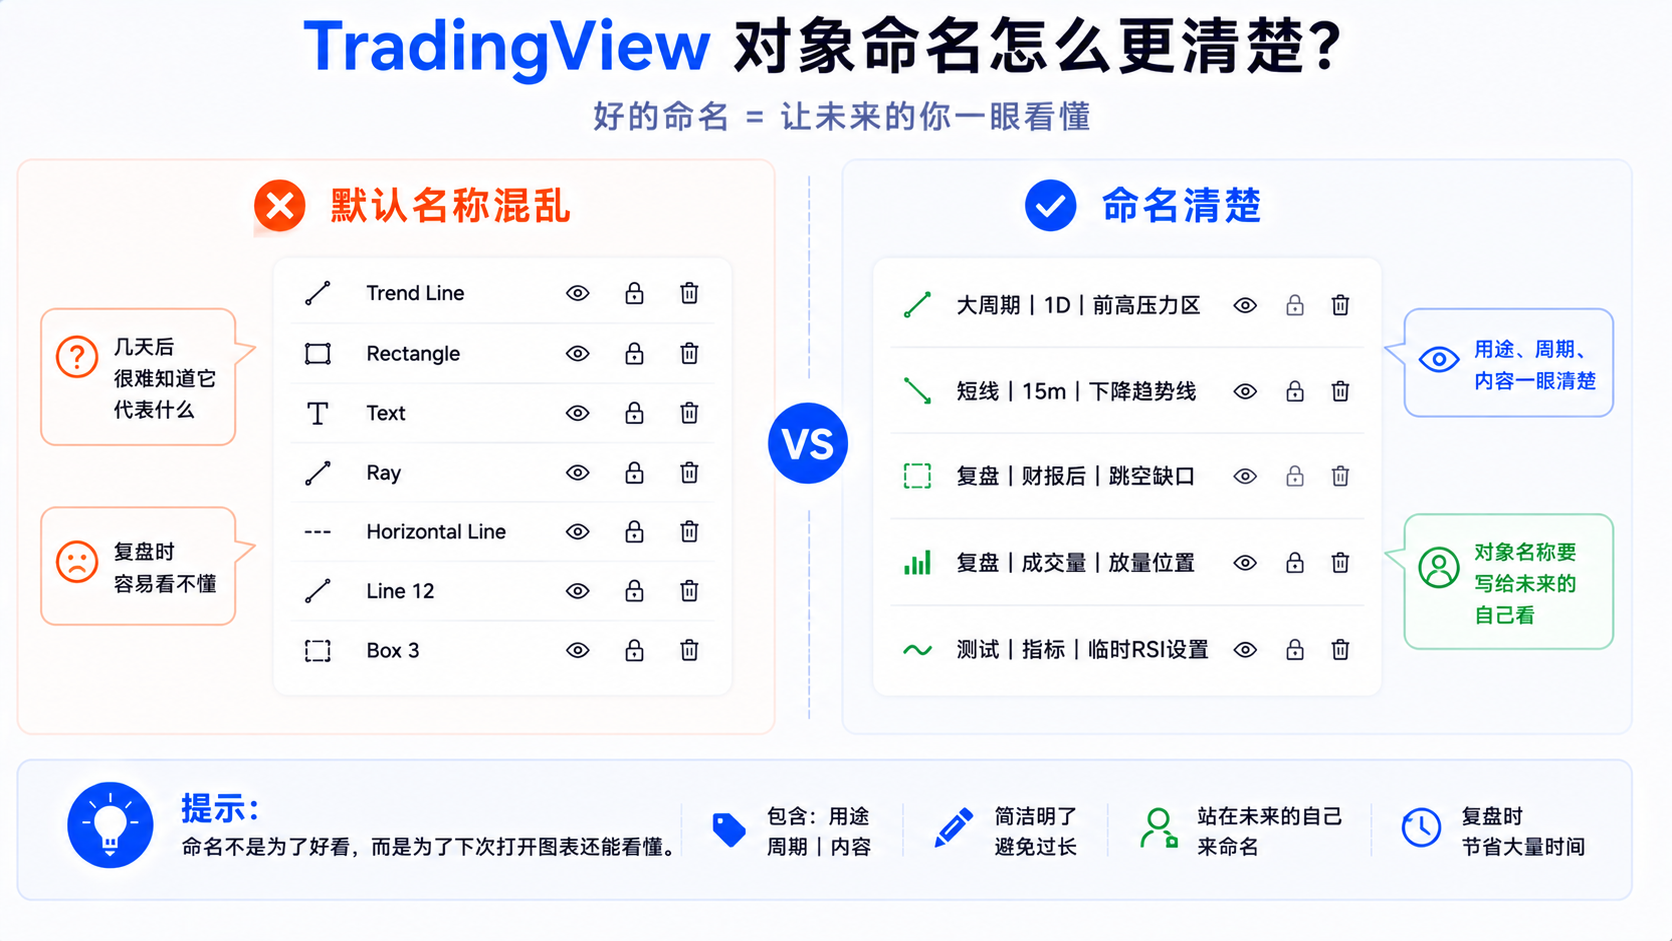
Naming is so your future self can understand it, not for looks.
Common Mistakes: Why the Object Tree Gets Messier With Use
Mistake 1: Draw but Never Delete
Only adding and never cleaning up will surely make the Object Tree go out of control.
Mistake 2: Not Naming Objects
All default names make purpose hard to judge.
Mistake 3: Keeping Short-Term Objects Long-Term
A 15m temporary line isn't necessarily worth keeping for weeks.
Mistake 4: Using Hiding Instead of Organizing
Hiding everything without deleting just moves the mess from the chart to the background.
Mistake 5: Not Checking Before a One-Click Delete
Remove Drawings & Indicators may delete important content by mistake.
Summary: The Object Tree Is for Tidying the Chart, Not Piling On More Objects
The Object Tree manages drawings, shapes, text, and indicators, supporting hide, show, lock, and delete. The more you draw, the more you need it—learning when to hide, delete, and keep matters more than just knowing how to draw. A good chart isn't one with more markers, but one where every marker is useful.
FAQ
Where is the TradingView Object Tree?
Usually open it via Object Tree and Data Window on the right; you can hide, show, or delete objects. Specifics follow the current interface.
What can the Object Tree manage?
Trend lines, horizontal lines, rectangles, text, shapes, indicators, and so on—like a layer manager, good for managing everything together when there are many objects.
What's the difference between hiding and deleting an object?
Hiding temporarily doesn't display it; deleting removes it. Hiding suits temporary needs and deleting suits invalid content—don't only hide without deleting.
After locking an object in TradingView, can it still be deleted?
Locking prevents accidental dragging; it doesn't necessarily prevent deletion. Confirm important objects before deleting, and understand the related settings.
Which drawings should you keep after a review?
Keep higher-timeframe support/resistance, long-term trend lines, major events, and classic cases; clean up short-term temporary lines, expired text, duplicate rectangles, and test indicators.